
Overview: Where we stand and why it matters
The market just cleared a clearly defined upside target for Bitcoin, and that event changes the immediate technical landscape. The move erased a level of liquidity that traders were watching on the liquidation heat map, and while that’s bullish in the short run, the structure above the price is now thinner. At the same time, many altcoins are flashing mixed signals—Ethereum is showing a short-term warning, while Solana, XRP, and Chainlink are playing out bullish divergences on shorter time frames.
This piece breaks down the technical story across multiple time frames, explains what the liquidation heat map means for momentum and liquidity, and gives practical scenario-based trade ideas and risk rules you can use whether you trade long, short, or simply manage an allocation. Expect clear levels to watch, likely near-term outcomes, and simple decision rules you can apply during choppy sessions.
Key takeaways
- Bitcoin just hit a pre-identified upside target, removing a node of liquidity that had been attracting stops and leveraged orders.
- Short-term structure remains more bullish than bearish: higher highs and higher lows on small time frames support the possibility of further relief rallies.
- Liquidity is now concentrated below price; that suggests pullbacks could be strong if sellers exploit those zones.
- Ethereum shows a short-term bearish divergence—expect a cool-off or choppy sideways action over the next few sessions.
- Solana, XRP, and Chainlink are currently trading in patterns consistent with short-term bullish relief, but larger time frame divergences remain unresolved for some.
- Have clear levels, risk limits, and a plan for both breakouts and failure scenarios; the market can flip quickly when liquidity pockets are thin.
How to read liquidity maps and why they matter
Liquidity maps are not fortune-telling tools, but they are excellent situational-awareness aids. They show where stop-loss orders, margin calls, and clustered orders are likely to exist. When price approaches a visible liquidity node, it can fuel short squeezes, long liquidations, or a magnet-like pull towards those levels. Removing a liquidity node means the market has already “collected” those orders, which changes future probability of immediate follow-through in that direction.
Practical implications:
- If a liquidity node above price is wiped out, there is less immediate price fuel above—making further upside extensions less certain without fresh buy-side volume.
- If large pools of liquidity sit below price, downside moves can accelerate quickly as those orders are triggered; on the flip side, they also act as magnet points where price may bounce.
- Trade plans work best when aligned with liquidity structure: try to enter where liquidity suggests rebounds or where failure would be contained by known support levels.
Bitcoin technicals — multi-timeframe map
Bitcoin’s technical story is best understood across multiple time frames. Each frame tells a different part of the narrative. Here’s the breakdown and what to watch.
Weekly frame
The weekly super trend remains red, signaling that the larger trend is still subject to bearish pressure. There is also a significant bearish divergence lingering on the weekly charts. That does not mean an immediate crash is imminent, but it does mean bulls are not fully in control on the biggest timeframe. When the weekly trend is mixed like this, expect chop and relief rallies rather than clean, trend-consistent breakouts.
Three-day frame
On the three-day chart, a smaller bullish divergence is currently active. Divergences on this timeframe commonly produce relief rallies or extended sideways ranges that can last days to weeks. The three-day bullish divergence complements the idea that we could continue to see short-term upside or choppy consolidation before higher-timeframe trends are settled.
Daily frame
Daily price action is in a sideways range. Key bounds to watch:
- Support: ~85,000–86,000
- Resistance: ~92,000–94,000
Because the daily range is intact, intraday price swings are likely to oscillate between these levels until the daily range breaks with conviction. When range-bound, expect false breakouts and quick re-tests.
Six-hour frame and the recent breakout
Zooming in, a six-hour breakout above ~89.9k was confirmed. That breakout briefly failed on a confirmation signal, then price returned above the level. When price trades above, then below, then back above a key level within a short period, that level’s significance weakens; the market is essentially discounting it as a clean line in the sand.
At the same time, there was a fresh layer of liquidity visible at ~91k on the liquidation heat map, which acted as a short-term magnet. Price precisely reached that liquidity node and absorbed it. That’s why the recent move felt efficient and targeted.
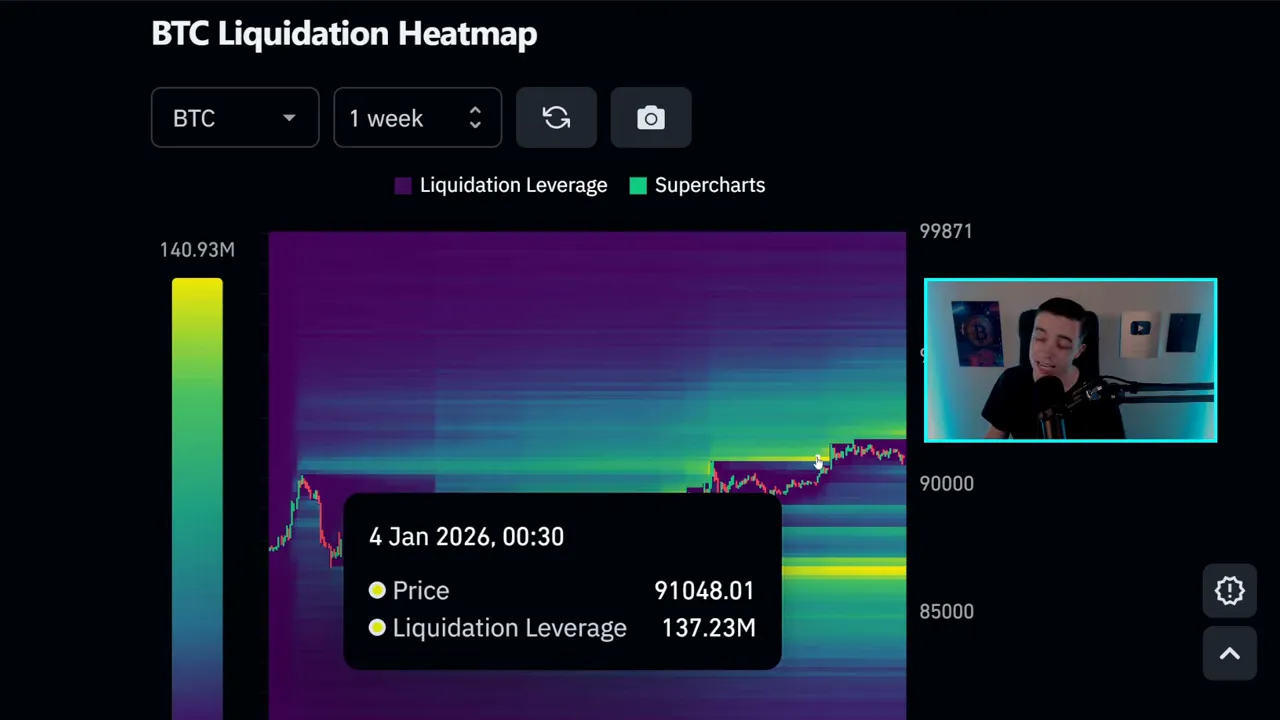
Current liquidity profile and short-term probabilities
Two shifts matter now:
- Liquidity above price is thinner after the 91k node was taken out.
- Significant liquidity remains beneath price in the 86.5k–86.7k area.
What this means in practice:
- Upside: Because the immediate overhead liquidity is thin, further upside requires fresh buying volume rather than simply momentum-based liquidity sweeps.
- Downside: The concentration of liquidity below price makes a retracement to the 86.5k zone a plausible and relatively higher-probability scenario than a direct drive above 94k in the very near term.
Given the short-term price structure is currently making higher lows and higher highs on smaller time frames, the technical bias leans bullish for relief rallies. Still, the presence of resistance in the 92k–94k band suggests any retest will be contested.
Practical plan for Bitcoin traders
Whether you swing trade, scalp, or manage a long-term allocation, clarity in levels and rules reduces emotion. Consider the following framework:
For aggressive traders (short-term entries)
- Opportunity zone: buy small on confirmed short-term pullbacks to intraday supports (look for volume confirmation and candle rejection wicks).
- Targets: resistance cluster near 92k; larger target 94k if momentum continues.
- Failure rules: if price breaks down below 86k with volatility and follow-through, trim longs and consider short exposure only if structure confirms lower highs on the daily.
- Risk per trade: cap at a small fixed percentage (for many traders 0.5–1.5% of capital) given higher intraday volatility.
For conservative traders (position size, swing trades)
- Wait for daily close above the 92–94k band for confirmation of a more sustainable upside leg.
- If price retraces to the 86–86.7k liquidity zone and shows strong bullish price action (engulfing candles, high volume, RSI recovery), consider adding to positions with scaled entries.
- Keep an eye on weekly super trend and long-term bearish divergence—they remain reasons to size positions smaller or hedge during rallies.
Ethereum: short-term warning but higher-level support holds
Ethereum recently confirmed another daily candle close above previous resistance, which now acts as support roughly in the $3,000–$3,100 range. That flip is constructive for further upside attempts, with immediate resistance around $3,200–$3,250 and then $3,400 beyond that.
Immediate short-term alarm: bearish divergence on small frames
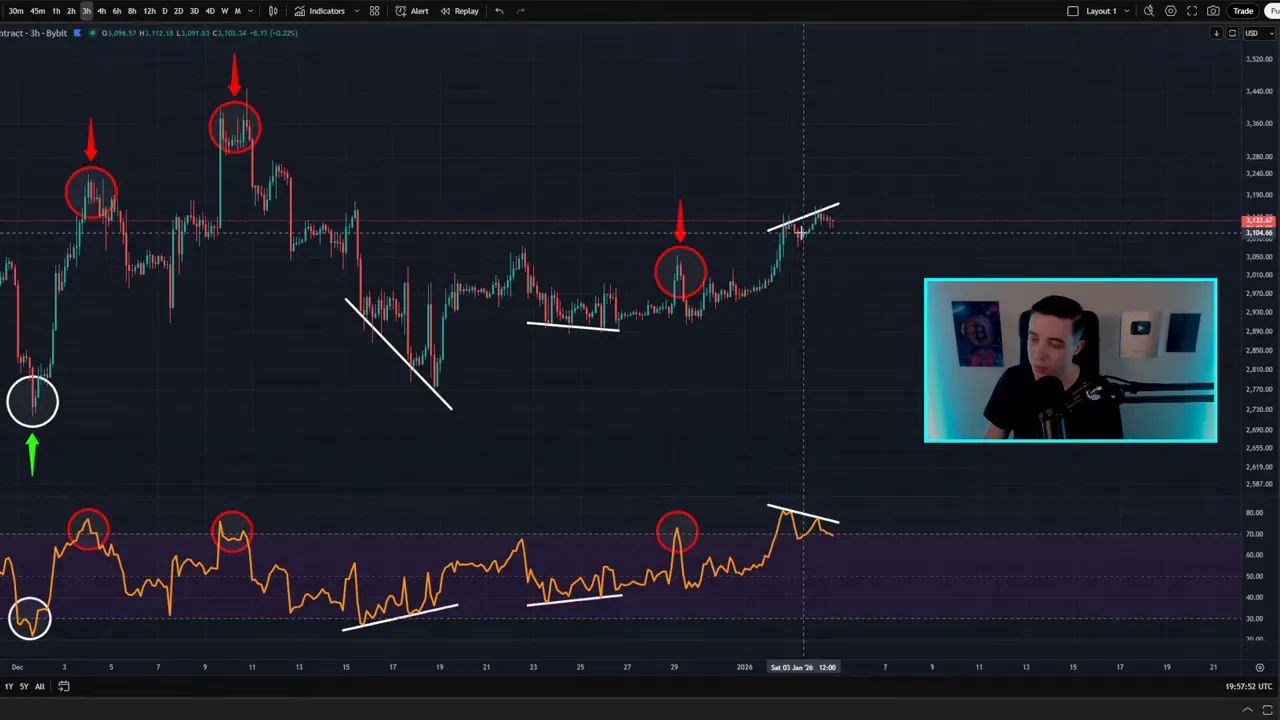
On the 3-hour chart there’s a short-term bearish divergence between price (marginally higher) and RSI (lower highs). Here’s the practical readout:
- Divergence type: price higher high vs RSI lower highs — classic short-term momentum warning.
- Typical outcome: a modest cool-off, sideways chop, or small pullback that relieves overbought conditions before continuation is attempted.
- Time horizon: this is an intra-to-short-term signal affecting the next few hours to days, not weeks.
Trading ideas for Ethereum
- If you are long: tighten intraday stops or scale-out partial positions on strong bearish momentum signals from the 3-hour timeframe.
- If you are looking to buy: wait for a retracement to $3,000–$3,100 support and watch for bullish confirmation on the 4-hour / daily sessions before layering in.
- If you are willing to short: this is a short-term setup only. Short on a failed retest of $3,200–$3,250 with stops above $3,400 and tight risk control.
Solana: daily bullish divergence and the bounce roadmap
Solana is playing out a bullish divergence on the daily time frame. Daily bullish divergences often resolve as relief rallies or extended sideways consolidation where the price grinds higher while momentum indicator recovers.
Key levels
- Support: strong around ~$125, then minor support at ~$130–$131.
- Resistance: immediate band around $143–$147.
Expected behavior: continued choppy upside or consolidation with occasional attempts to test the next resistance cluster. Bullish divergence gives probability to relief rallies, but these can stall into range-bound action if broader market liquidity is lacking.
Strategy ideas
- Buy small on clean retests of $125–$131 with defined stops under the structure low.
- Take profits incrementally near the $143–$147 resistance zone unless a daily close above resistance validates a new leg up.
- If price rejection occurs at resistance, assess whether the daily momentum is still improving or if the divergence has been exhausted; a failure can lead to a re-test of lower supports.
XRP: higher timeframe risk, short-term opportunity
Looking at XRP, the weekly chart still contains a large bearish divergence that has yet to be invalidated. That implies caution on any long-term bias. However, XRP is currently bouncing off a major support near $1.80 and a smaller bullish divergence is active on the daily chart. This combination offers short-term relief trade potential while the larger trend remains unresolved.
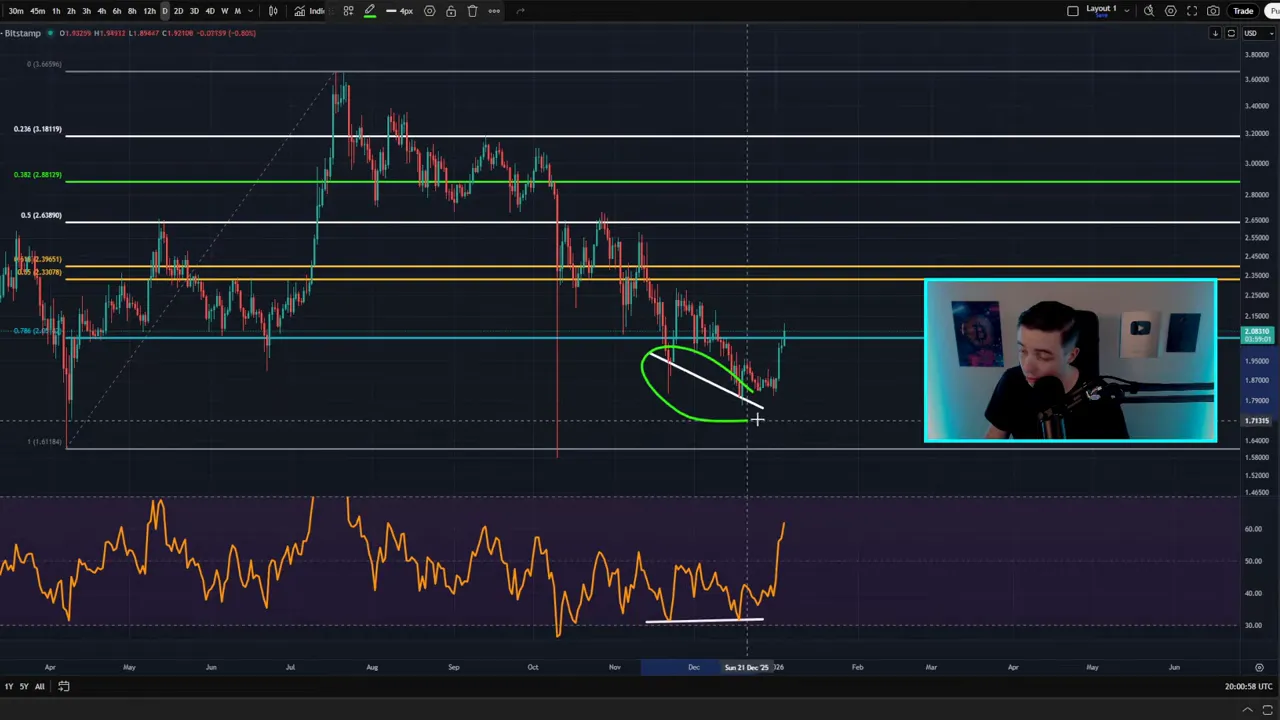
Important price zones
- Major weekly support: ~$1.80
- Short-term pivot and newly established support: $2.00–$2.05 (daily candle close above $2.05 would be constructive)
- Resistance: $2.15–$2.20
If the daily candle closes above $2.05 and holds, expect $2.15–$2.20 to be contested. Failure to hold $2.00 could bring a test of the $1.80 level again, and the larger weekly divergence will remain a factor for sizing and conviction.
Chainlink: short-term bounce hitting resistance zone
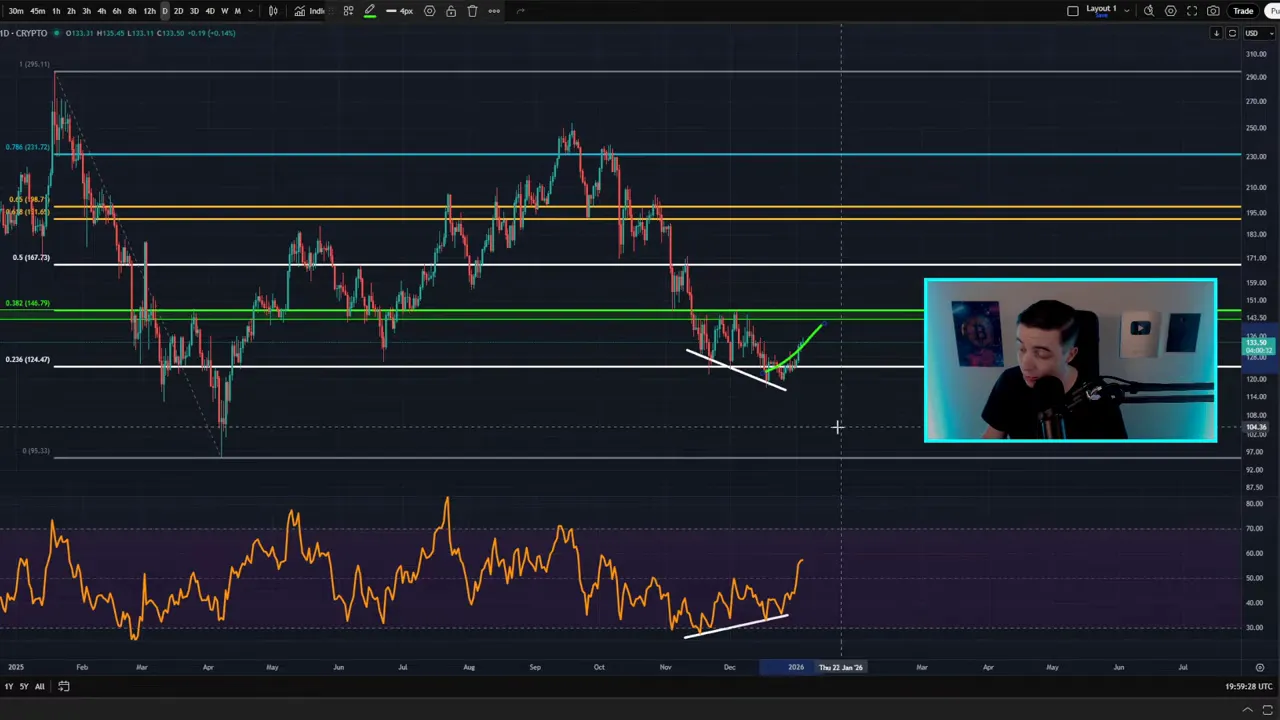
Chainlink shares a common theme: bullish divergence on shorter time frames producing relief rallies while longer-term structure still needs time to recover. Chainlink is currently bumping up against a resistance band right near $13.30–$13.50, which is where price is showing visible struggle.
Decision framework for LINK
- If LINK breaks and confirms above $13.50 with a daily close, that level flips to support and the next resistance to watch becomes the $14.70–$15.00 zone.
- If the breakout fails, expect support around $12.50–$12.80. That area can be used for re-entry or as a stop placement for short-term buyers who bought the initial rally.
- Manage position sizes given the higher chance of short-lived false breakouts in choppy markets.
Market context: Bitcoin dominance and altcoin behavior
Bitcoin dominance is currently neutral and has been trading sideways. Neutral dominance means altcoins and Bitcoin tend to follow similar paths on average. That usually translates to altcoins performing in step with Bitcoin—no explosive relative rotation one way or the other until Bitcoin dominance breaks decisively.
Actionable implication: if Bitcoin leads higher, expect altcoins to pick up moderately unless dominance expands rapidly. Conversely, if Bitcoin cools and dominance tightens, altcoins could lag and face deeper pullbacks. Position sizes and allocation should be adjusted depending on which scenario is more likely based on price action and liquidity cues.
A simple checklist for navigating the next sessions
- Identify where liquidity pockets are sitting relative to price (heat maps or orderbook clusters).
- Monitor small-timeframe divergences—RSI divergence on 3-hour or 4-hour charts frequently signals short-term cooling.
- Define exact support and resistance levels in advance and commit to stop-loss rules.
- Scale in and out rather than trying to pick a single perfect entry.
- Keep an eye on Bitcoin dominance and the weekly super trend for higher-timeframe risk context.
- If trading with leverage, reduce size when overhead or below-price liquidity is thin—you can get quick and violent moves when liquidity is scarce.
Concrete trade scenarios with targets and stops
Below are example scenarios suited for different risk profiles. These are not recommendations but example templates for planning and risk control.
Scenario A — Short-term bullish continuation (aggressive)
- Instrument: Bitcoin spot or perpetuals
- Entry: on a pullback to an intraday support area with bullish price rejection (e.g., wick, volume spike)
- Initial target: 92k resistance zone; scale partial profits.
- Secondary target: 94k if momentum continues.
- Stop: a daily close below 86k for larger positions or a tight intraday stop just below the entry for scalps.
- Risk control: keep trade risk per position small (0.5%–1.5%).
Scenario B — Defensive swing (conservative)
- Instrument: Ethereum or selected altcoins
- Entry: wait for daily confirmation above support zones (e.g., ETH above $3,100 with volume confirmation)
- Target: conservative gains to $3,200–$3,400, depending on momentum.
- Stop: daily close below the support flip (e.g., $3,000) to avoid being caught by false breakouts.
- Position sizing: smaller positions until the weekly super trend shows favorability for bulls.
Scenario C — Tactical short (opportunistic)
- Instrument: altcoin showing short-term bearish divergence (e.g., ETH on 3-hour, LINK at resistance)
- Entry: short on a failed retest of resistance with clear rejection candle and increasing selling volume.
- Target: the next support node listed in the analysis (e.g., ETH $3,000 or LINK $12.70–$12.80).
- Stop: just above recent highs or the resistance band that failed.
- Note: this is a higher-risk move; use tighter sizing and quick profit-taking.
Risk management and mindset
Markets with thin overhead liquidity and concentrated below-price liquidity can move fast. That reality demands disciplined risk rules:
- Size your positions so that a single adverse move doesn’t destroy a large fraction of available capital.
- Use stop orders and plan exits before entering; emotion-driven exits usually cost more than planned ones.
- Scale entries and exits rather than going all-in; that reduces regret and improves flexibility.
- Avoid leverage spikes when structural indicators (weekly divergence, unclear dominance) suggest higher probability of chop.
How to adapt if the market flips
No plan survives every market. Be ready to update your thesis. Quick decision rules help:
- If Bitcoin tears significantly higher and closes daily above 94k with follow-through and increased volume, shift to a more bullish allocation and expand targets for selected altcoins.
- If Bitcoin breaks down and closes below the 85–86k support with strong selling and penetration of the below-price liquidity, rotate into defensive allocations and consider hedges or short strategies.
- If Bitcoin dominance spikes or collapses, adjust altcoin exposure accordingly; neutral dominance suggests balanced exposure, while rising dominance favors Bitcoin-heavy allocations.
Where to focus your attention this week
- Watch the 92k–94k band on Bitcoin for signs of strength or rejection.
- Monitor 86.5k–86.7k as the primary downside liquidity magnet.
- Track Ethereum’s RSI action on the 3-hour chart for short-term cooling signals.
- Observe Solana and Chainlink for continuation or rejection at their identified resistance levels.
- Use order flow data or a liquidation heat map to see where clustered stop orders build up so you can avoid being whipsawed by liquidity hunting moves.
Practical tools and final checklist
Set up a concise daily routine to keep your risk managed and your decisions objective:
- Open charts in the morning: load weekly, daily, and a lower-timeframe (3–6 hour).
- Identify liquidity nodes with a heat map or by noting clustered price action and past levels of consolidation.
- Mark key levels on each chart and set alerts for price proximity to those zones.
- Decide whether you will trade this volatility or sit on the sidelines based on your plan and risk budget.
- Log trades and emotions after the session; incremental improvement compounds faster than one big hit.
The market environment is a mix of short-term bullish structure and longer-term caution. That combination favors measured, rules-based trading: size small, set clear targets and stops, and let the market prove which scenario will dominate. Keep liquidity maps, trend indicators, and divergence signals in your toolbox—they help translate raw price action into actionable probability-based choices.
Next steps to act on this read
- Update your watchlist with the levels above and set alerts for the bands mentioned.
- If you trade actively, reduce size when liquidity is thin overhead and tighten stops on leveraged positions.
- If you invest, consider averaging into positions on confirmed support retests rather than chasing breakouts into thin liquidity.
- Maintain a trading journal and include why you entered each trade according to the checklist; the record will accelerate learning.
BITCOIN PRICE TARGET HIT: What’s Next for Bitcoin, Crypto, BTC, Blockchain, CryptoNews, Investing. There are any BITCOIN PRICE TARGET HIT: What’s Next for Bitcoin, Crypto, BTC, Blockchain, CryptoNews, Investing in here.

