
If you’ve been watching the cryptocurrency market closely lately, you’ve probably noticed something exciting: Bitcoin has just hit a brand new all-time high. This surge, alongside Ethereum’s strong momentum, signals that the crypto market might finally be waking up from a long slumber. But what does this mean for investors, traders, and the broader blockchain ecosystem? Is it really time to get bullish? In this comprehensive analysis, we’ll dive deep into the latest Bitcoin price action, key technical levels to watch, Ethereum’s outlook, and how these developments could impact the entire crypto market.
Whether you’re a seasoned investor or just starting your crypto journey, understanding these market dynamics can help you make more informed investing decisions. So grab your favorite cup of coffee—hot or iced—and let’s get into the details of what’s driving the Bitcoin rally and what to watch for as we head into the weekend and beyond.
Bitcoin’s New All-Time High: What’s Behind the Surge?
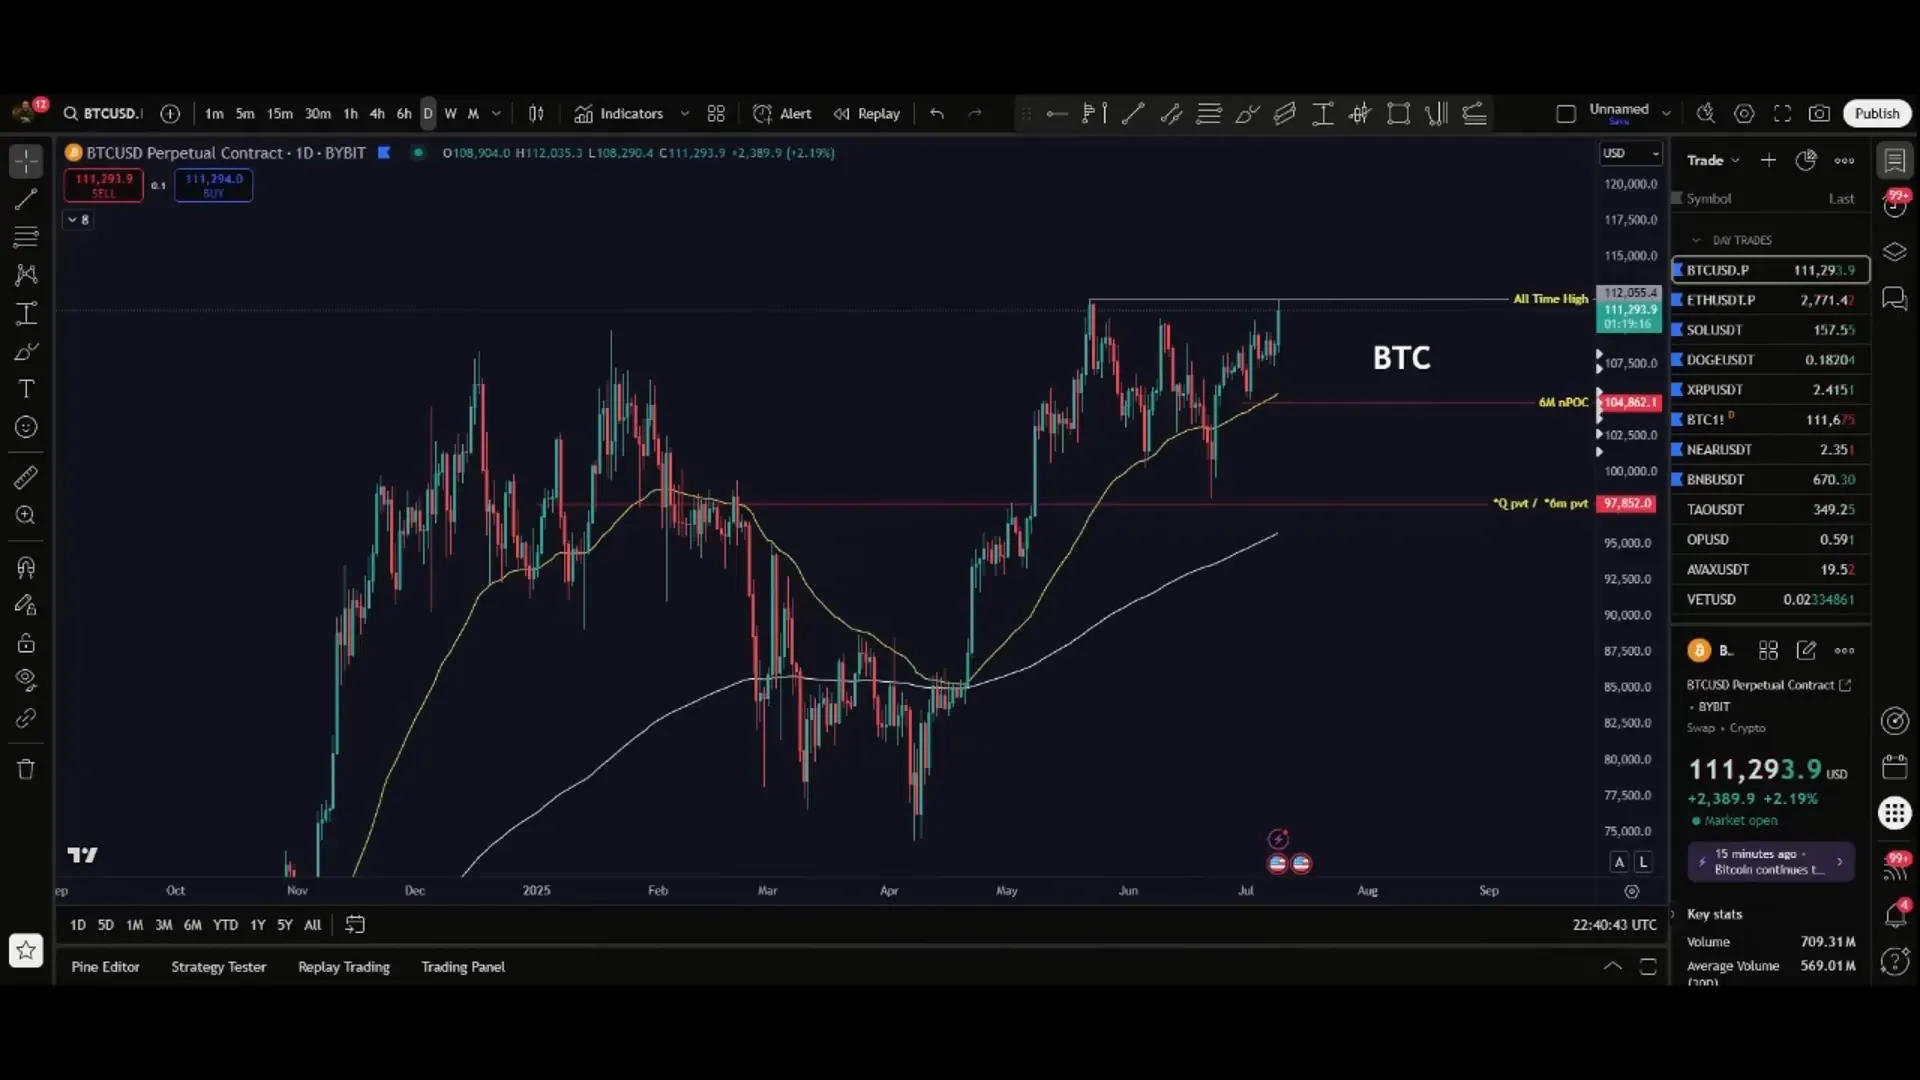
Bitcoin’s recent price action has been nothing short of remarkable. After a period that felt like watching paint dry, Bitcoin finally pushed through to new all-time highs across multiple exchanges such as Coinbase, Binance, and Bybit. While the exact peak varies slightly depending on the exchange—ranging from a few dozen to a couple hundred dollars difference—the overall picture is clear: Bitcoin is back in the spotlight.
On Bybit, Bitcoin just touched the all-time high region, almost to the dollar, signaling a critical test of resistance. This begs the question—is this surge just a short-lived rally, a typical “pump and dump,” or the start of a sustained, parabolic move? Could we see Bitcoin climb to $130,000, $140,000, or even $150,000 this summer? These are the questions every trader and investor is asking right now.
Key Technical Levels to Watch
To answer this, it’s important to understand the critical price levels that Bitcoin is navigating. Currently, three main levels stand out on the charts:
- All-Time High (~$110,000): This is the immediate resistance Bitcoin has just approached.
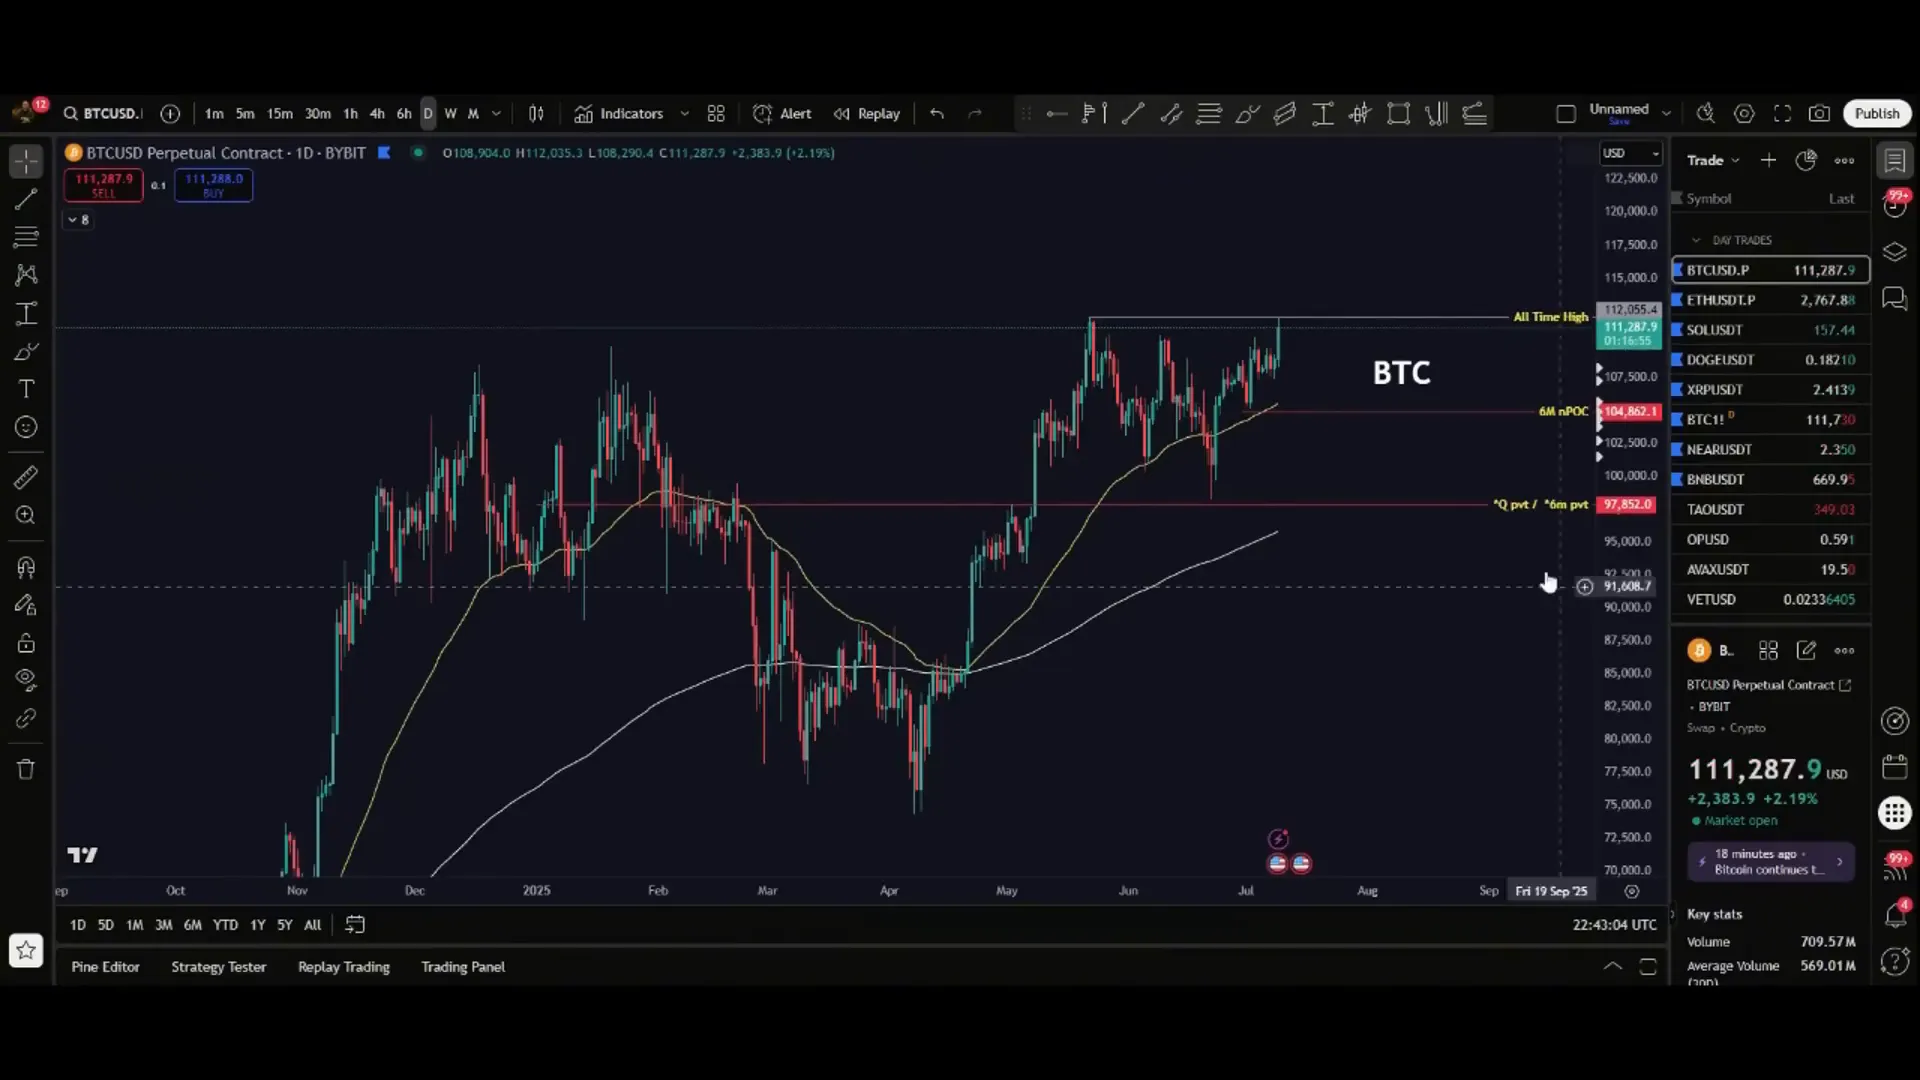
- High Volume Node at ~$105,000: Known as a “naked point of control,” this is a high-volume price level from a previous trading range that could act as support if Bitcoin retraces.
- Support Zone around $98,000: Another key volume level where Bitcoin previously found buying interest.
These levels are crucial for traders planning their entry and exit points. The $105,000 level is especially interesting because it coincides with Bitcoin’s 50-day moving average, adding further confluence as a support area.
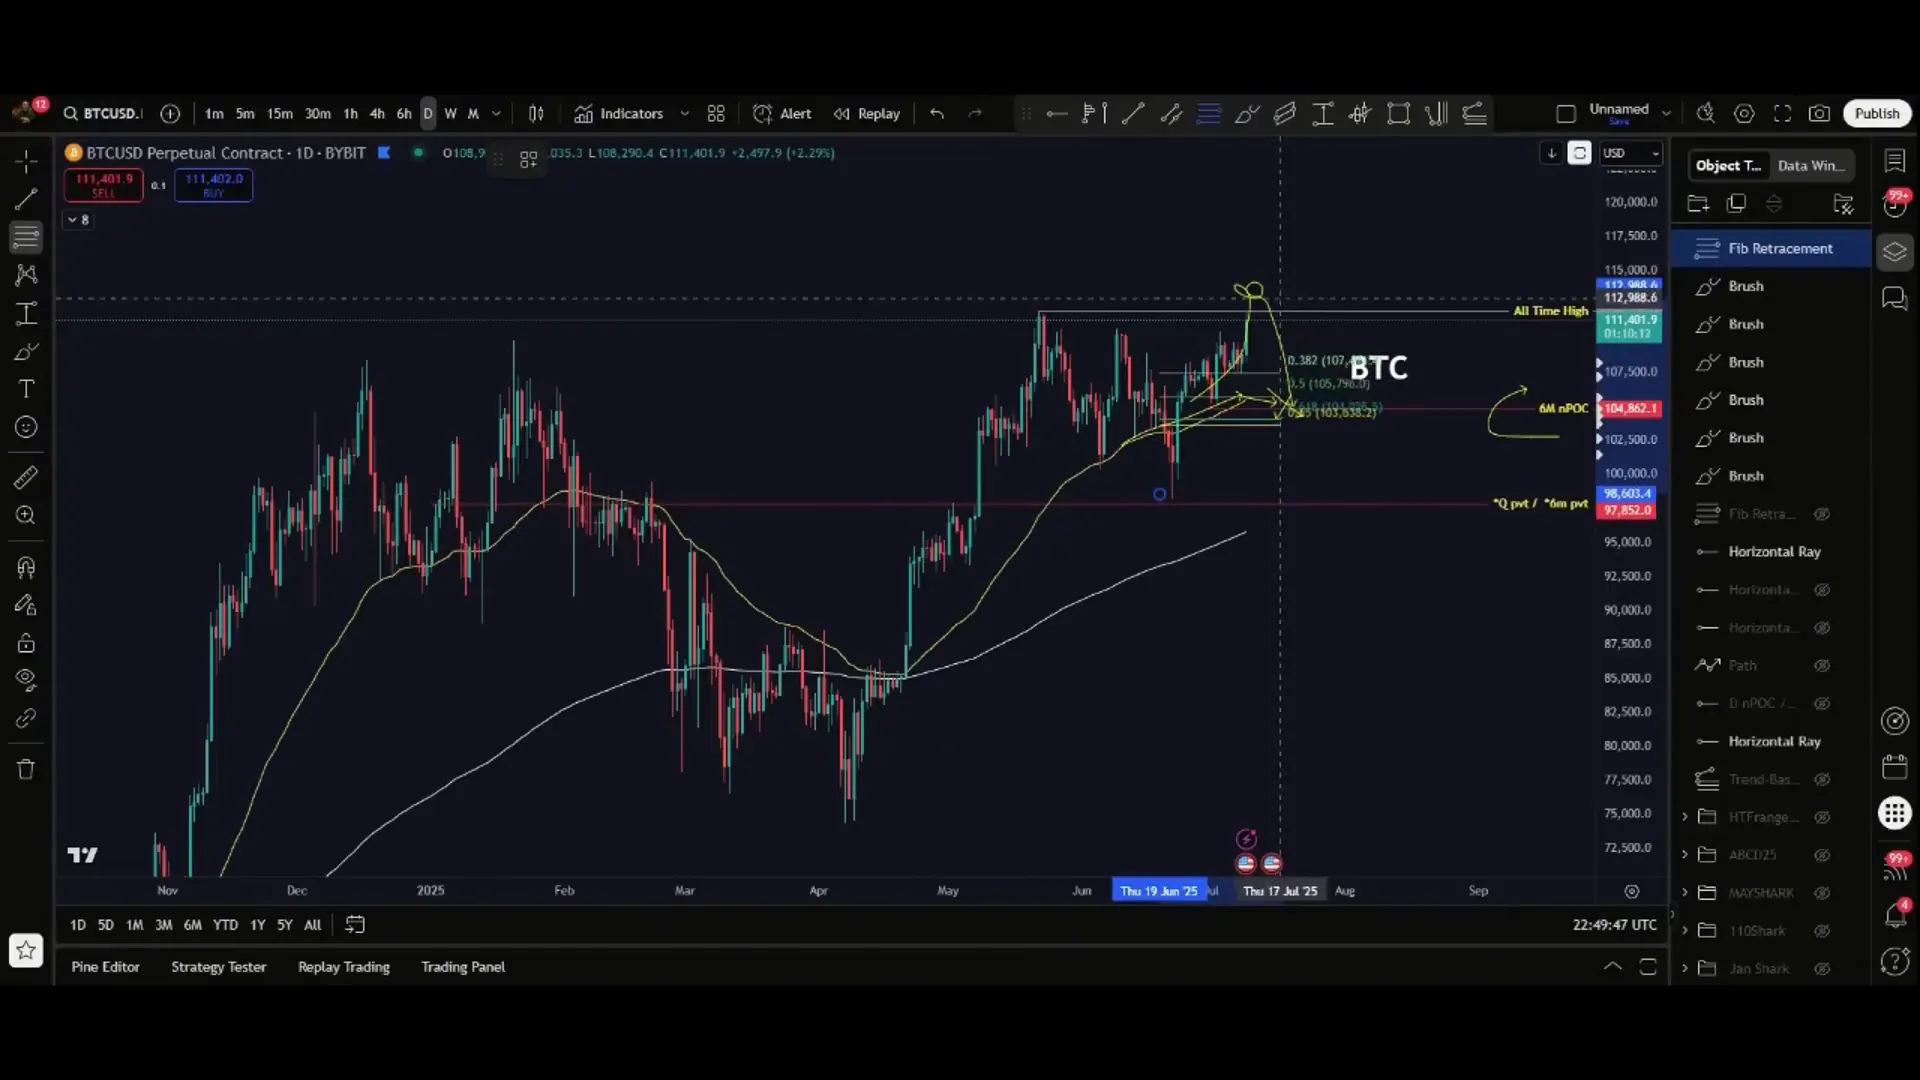
Moreover, there is a harmonic pattern that has been developing for months, targeting a pullback near $93,000. While Bitcoin has so far only pulled back to about $98,000—a five percent “front run” above the target—this lower zone remains a valid area to watch for potential support and fresh entries.
Is Bitcoin Ready for a Real Breakout?
The market often reacts to these key points in nuanced ways. For example, if Bitcoin breaks decisively above the current all-time high and holds that level, the next resistance areas lie around $114,000 and then between $120,000 and $125,000. These levels are associated with Fibonacci retracements and “gold pocket” zones—areas where traders often expect price reactions.
However, the presence of liquidity sweeps—where stop losses of recent buyers are targeted just below key levels—means volatility could increase. The 200-day moving average is also creeping upward around the $98,000 to $100,000 region, making this a critical zone to watch for any pullbacks.
In short, Bitcoin is at a crossroads. A failure to sustain above the all-time high could lead to a pullback to the $98,000 or even $93,000 zones. But a confirmed breakout could set the stage for a parabolic move higher, potentially pushing Bitcoin into the $130,000 to $135,000 range by the end of summer.
Market Context: Why Bitcoin’s Strength Matters
Amidst the broader crypto market, Bitcoin’s recent strength is a beacon of hope. While many altcoins have been making new lows—some even hitting all-time lows—the fact that Bitcoin is pushing higher is significant. For those invested in altcoins, this is a critical observation: Bitcoin’s health often sets the tone for the entire market.
For long-term investors, Bitcoin’s rally is a positive sign that the market may be entering a new phase of bullishness. Even if a pullback occurs, the correction is expected to be moderate—around 10 to 15 percent from recent highs—and not a catastrophic collapse. This healthy correction would provide a solid foundation for the next leg up.
Planning for Entries: Where to Look
For traders and investors looking to enter fresh positions, identifying the right price zones is crucial. The two key areas to watch for Bitcoin pullbacks are:
- Mid-Tier Support: $105,000 — This aligns with a major volume node and the 50-day moving average.
- Lower Support Zone: ~$98,000 — A high-volume support area and close to the 200-day moving average.
These zones are where you’ll likely find strong buying interest and potential altcoin entry points, as altcoins tend to correlate with Bitcoin’s movements. If Bitcoin finds support here, it could ignite a broader market rally.
Technical analysis is powerful because it helps you prepare and plan, so you’re not reacting emotionally but strategically. Mark these levels on your charts and watch how price behaves as it approaches them.
Short-Term Bitcoin Price Action: What Happened This Week?
Understanding the recent price action helps set expectations for the near term. Here’s a breakdown of Bitcoin’s weekly range and movements:
- Monday: Price traded near the previous week’s range, touching the point of control (POC) – a high-volume price level.
- Tuesday: Bitcoin swept below Monday’s low briefly, shaking out weak hands, then rallied back to test Monday’s high.
- Midweek: Price consolidated and then broke out above the previous week’s high, signaling bullish momentum.
- Late Week: Bitcoin approached and tested the all-time high, confirming a breakout across most exchanges.
This sequence is typical of a healthy market: a shakeout to remove weak positions, followed by a rally and breakout. The fact that Bitcoin has cleared the $109,000 level and is challenging all-time highs is a bullish sign for the near term.
Additionally, Bitcoin’s breakout aligns with new all-time highs in traditional equity markets like the Nasdaq and S&P 500, suggesting a broader risk-on environment that crypto is benefiting from.
Ethereum’s Rally: Signs of Strength in the Altcoin Market
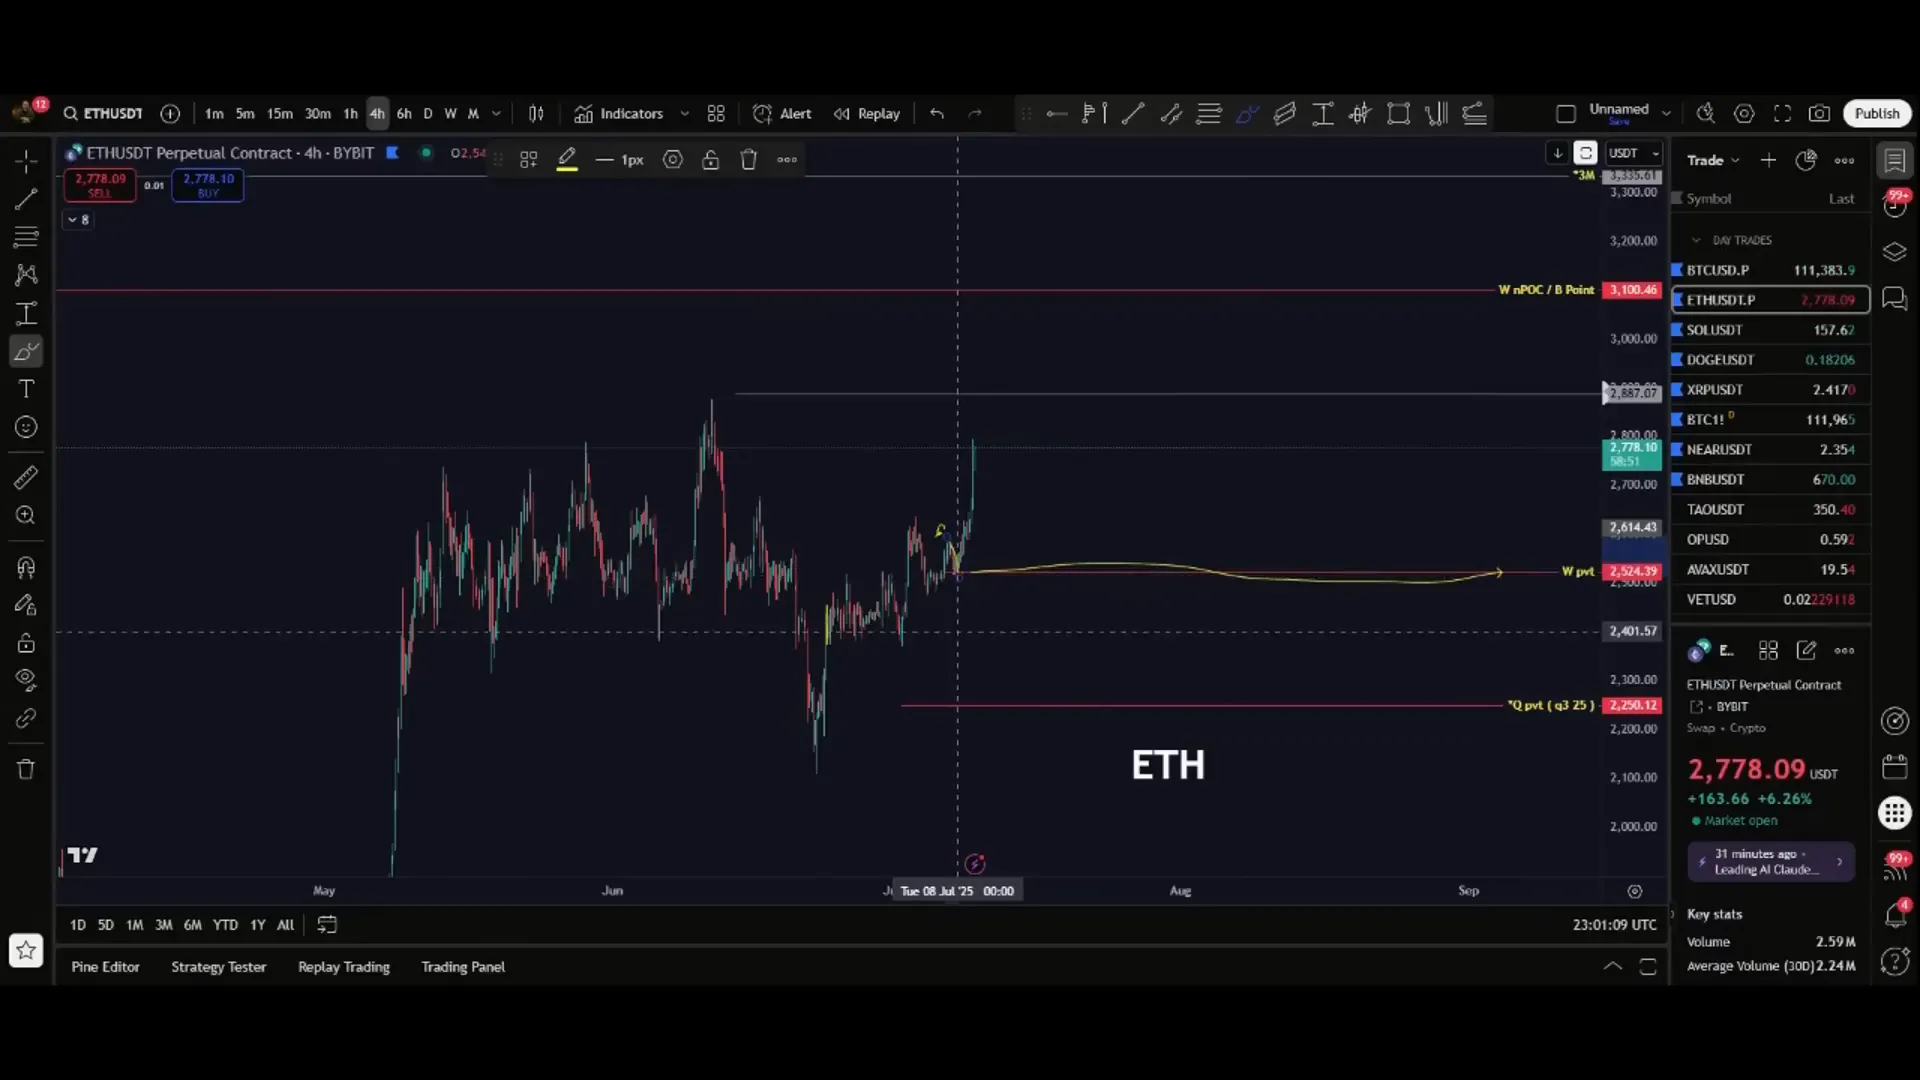
While Bitcoin leads the charge, Ethereum (ETH) is showing encouraging signs as well. Ethereum recently generated a weekly pivot point—a technical indicator based on last week’s average price—which acted as a launchpad for its current rally.
Ethereum started the week near this pivot, pulled back slightly, and then surged higher, moving towards its recent highs around $2,880 to $2,900. The next significant resistance lies near $3,100, a level derived from both harmonic patterns and Fibonacci retracements, specifically the “gold pocket” zone (61.8% to 65% retracement).
Targets and Pullback Zones for Ethereum
If Ethereum clears the $3,100 resistance convincingly, the next target is around $3,300. However, investors should also be prepared for potential pullbacks, which are healthy in any bull market.
Key support levels to watch for fresh entries include:
- $2,250: The average price for the last quarter, acting as a long-term support zone.
- $1,800 to $1,900: Stronger support levels if a deeper correction occurs.
These levels are similar to Bitcoin’s moving average supports and provide good buying opportunities in case of a market retracement.
What This Means for Crypto Investors and Blockchain Enthusiasts
Bitcoin and Ethereum’s recent price action shows a market that’s potentially transitioning from a prolonged consolidation phase into a new bullish cycle. For investors, this means it’s essential to stay vigilant, plan your entries around key technical levels, and watch how the market reacts as it approaches these milestones.
The blockchain space continues to innovate and expand, with institutional adoption and technological upgrades driving long-term value. However, the market’s immediate trajectory depends heavily on how Bitcoin and Ethereum perform in the coming weeks.
Altcoins, which have struggled recently, often follow Bitcoin’s lead. A sustained Bitcoin rally could breathe new life into the broader crypto ecosystem, but caution is warranted as volatility remains high.
Stay Ahead of the Curve
For those serious about navigating this exciting yet volatile market, staying updated with real-time market analysis and trade setups is invaluable. Consider joining communities and platforms that offer in-depth insights and macro trend breakdowns to sharpen your edge.
Remember, every investment carries risk, and past performance is not a guarantee of future results. Do your research, manage risk carefully, and consider consulting a financial advisor if you’re unsure about your strategy.
Final Thoughts
Bitcoin’s breakout to new all-time highs, coupled with Ethereum’s strong push, marks a pivotal moment for crypto investors. While there’s potential for a parabolic move, key support and resistance levels must be respected. Whether you’re a trader looking for tactical entries or a long-term investor aiming to understand the market’s broader trajectory, now is the time to stay informed and prepared.
As we head into the weekend and the end of July, watch Bitcoin’s behavior around $110,000 and $114,000 closely. These levels will indicate whether the market is ready to accelerate higher or if a healthy pullback is on the horizon.
In the ever-evolving world of Bitcoin, crypto, blockchain, and investing, knowledge and preparation are your best allies. Stay sharp, stay curious, and here’s to making the most of the opportunities ahead.
Bitcoin Is Going Parabolic: Is It Really Time to Get Bullish on Bitcoin, Crypto, and Blockchain?. There are any Bitcoin Is Going Parabolic: Is It Really Time to Get Bullish on Bitcoin, Crypto, and Blockchain? in here.

