Welcome to an in-depth exploration of the current state of Bitcoin and the broader cryptocurrency market. In this comprehensive guide, we’ll delve into why a Bitcoin supply squeeze might be on the horizon, analyze the latest market movements, and assess the outlook for key cryptocurrencies such as Ethereum, Solana, XRP, and Chainlink. Drawing from the latest market data and strategic moves by major players like Michael Saylor and his company, Strategy, this article aims to equip you with the insights you need to navigate the evolving crypto landscape effectively.
Whether you’re an experienced investor or new to Bitcoin, understanding these dynamics is crucial for making informed decisions in crypto investing and trading. Let’s get started.
Why the Bitcoin Supply Squeeze Is Building
One of the most significant developments shaking the Bitcoin market recently is the announcement of another massive Bitcoin purchase by Strategy, the company led by Michael Saylor. Strategy has acquired nearly 5,000 Bitcoin in a single transaction, approximately 4,980 BTC, for over half a billion U.S. dollars—around $532 million—at an average price of roughly $106,800 per Bitcoin.
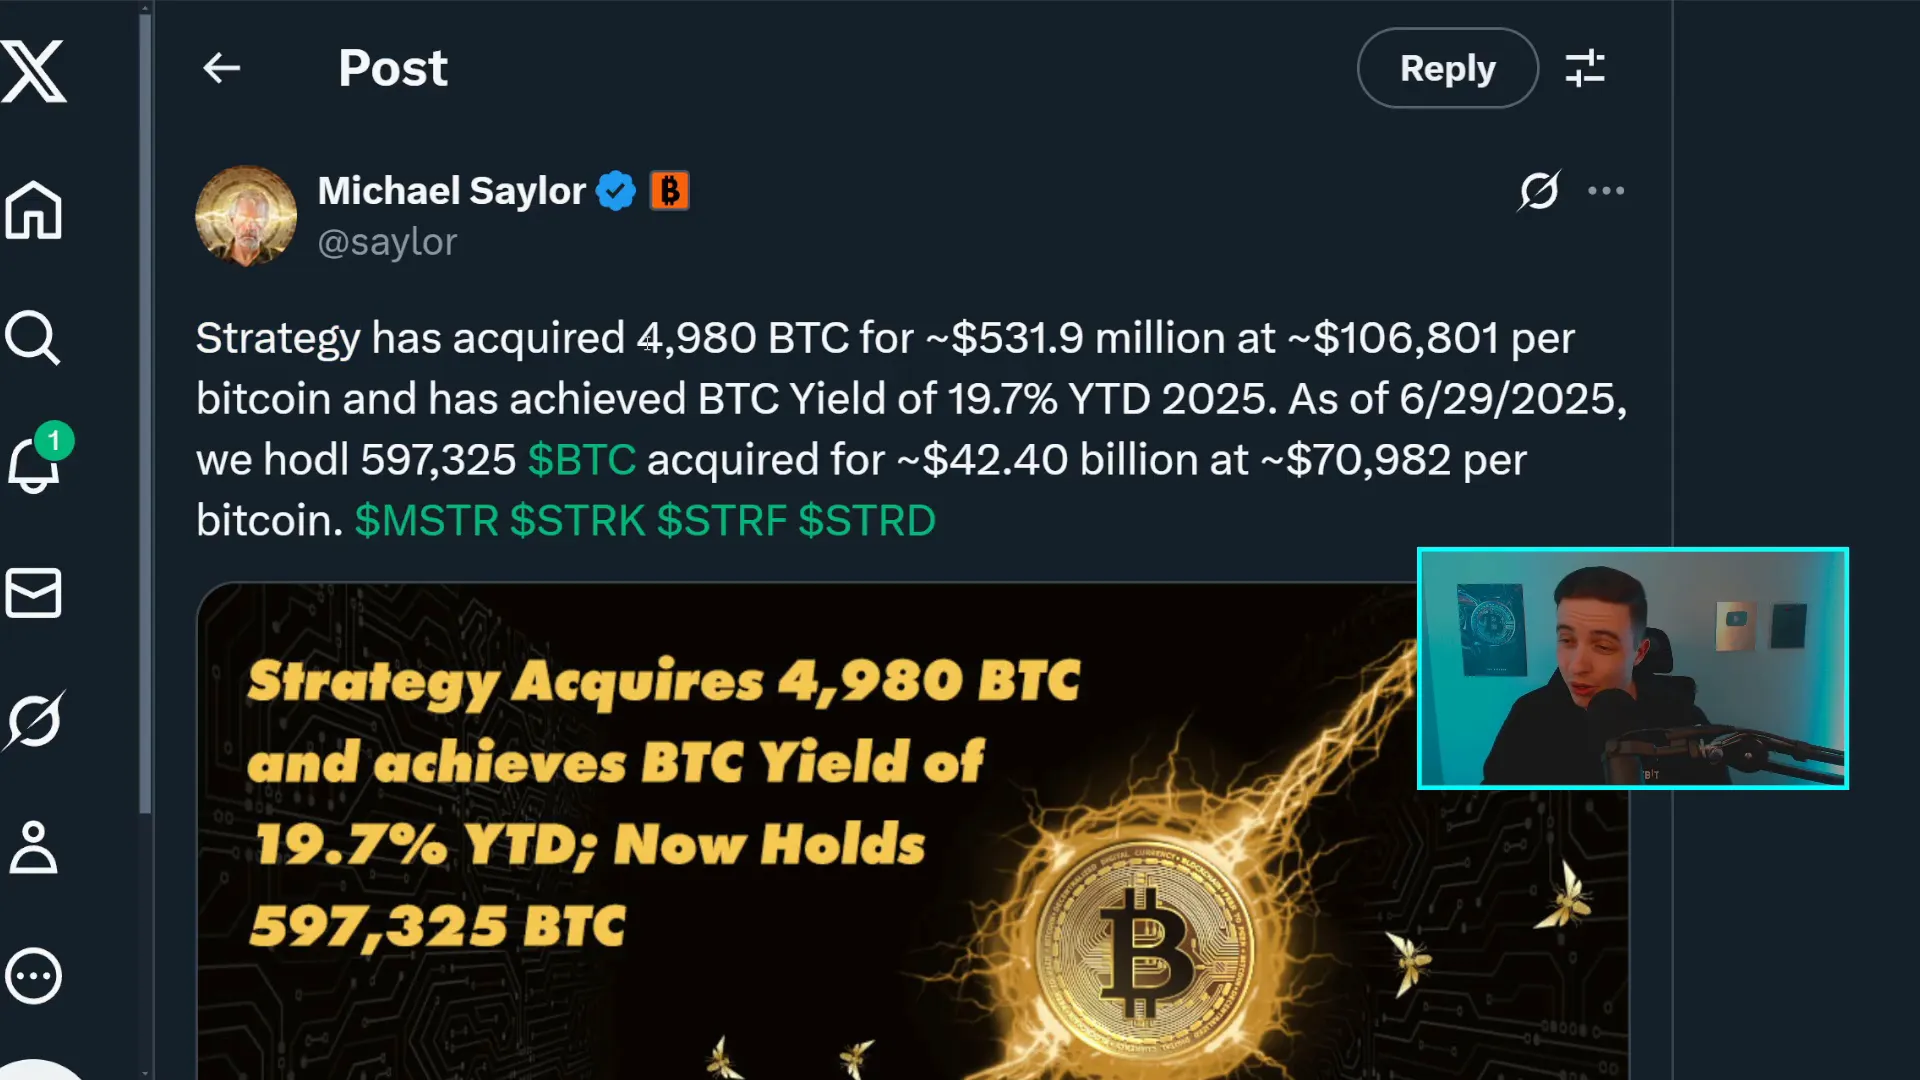
To put this into perspective, Strategy’s total Bitcoin holdings now approach 600,000 BTC, acquired at a cumulative cost exceeding $42 billion. This staggering figure means that Strategy alone holds close to 3% of Bitcoin’s total maximum supply. However, the implications go deeper when considering the liquid supply of Bitcoin—the portion that is actually available for trading and movement in the market.
Why does liquid supply matter? Because a significant amount of Bitcoin is essentially off the market. For example, it’s estimated that Satoshi Nakamoto, Bitcoin’s mysterious creator, holds roughly one million BTC, which have never moved. Additionally, millions of Bitcoins are believed to be lost forever due to forgotten keys or inaccessible wallets. Many holders also adopt a long-term “HODL” strategy, unwilling to sell for years or decades.
Factoring in these elements alongside the fact there is still over a million Bitcoin left to be mined out of the total supply, the actual liquid Bitcoin available for purchase or sale at current price levels is relatively small—just a few million coins give or take. This scarcity of liquid supply sets the stage for a potential supply squeeze.
In simple terms, a supply squeeze occurs when demand outpaces supply so significantly that buyers must compete by bidding prices higher to acquire Bitcoin. Strategy’s ongoing accumulation could be part of a deliberate strategy to corner a large portion of the liquid supply, removing it from circulation and forcing prices upwards as remaining sellers hold out for higher bids.
While individual large purchases like this don’t immediately spike Bitcoin’s price—since Strategy uses sophisticated methods to acquire Bitcoin without causing abrupt market moves—the long-term effect could be profound. As more Bitcoin is locked away by large investors and institutions, the reduced availability can create upward pressure on prices over many years.
"Fundamentally speaking, when we're talking about the supply and demand for Bitcoin over the long term, this is very bullish for the price of Bitcoin over the super long term."
Of course, this bullish narrative doesn’t preclude short-term pullbacks or bear markets. Price consolidations, corrections, and volatility are normal in crypto markets. But for those holding Bitcoin over a five to ten-year horizon, the outlook remains optimistic based on these supply-demand dynamics.
Bitcoin Price Analysis: Momentum, Resistance, and Support
Turning our attention to the Bitcoin price charts, the weekly time frame offers some interesting insights. The super trend indicator currently remains in the green, signaling a larger bull market is intact. However, the weekly MACD (Moving Average Convergence Divergence) shows a lack of momentum—not bearish, but not bullish either. This suggests Bitcoin is likely to continue trading sideways in a period of consolidation over the next several weeks or even months.
This sideways price action has already been playing out as predicted, with Bitcoin struggling to break above a descending line of resistance that has formed near the $108,700 to $108,800 level. Most recently, Bitcoin was rejected from this exact resistance range, signaling the market’s hesitation to push higher at this point.
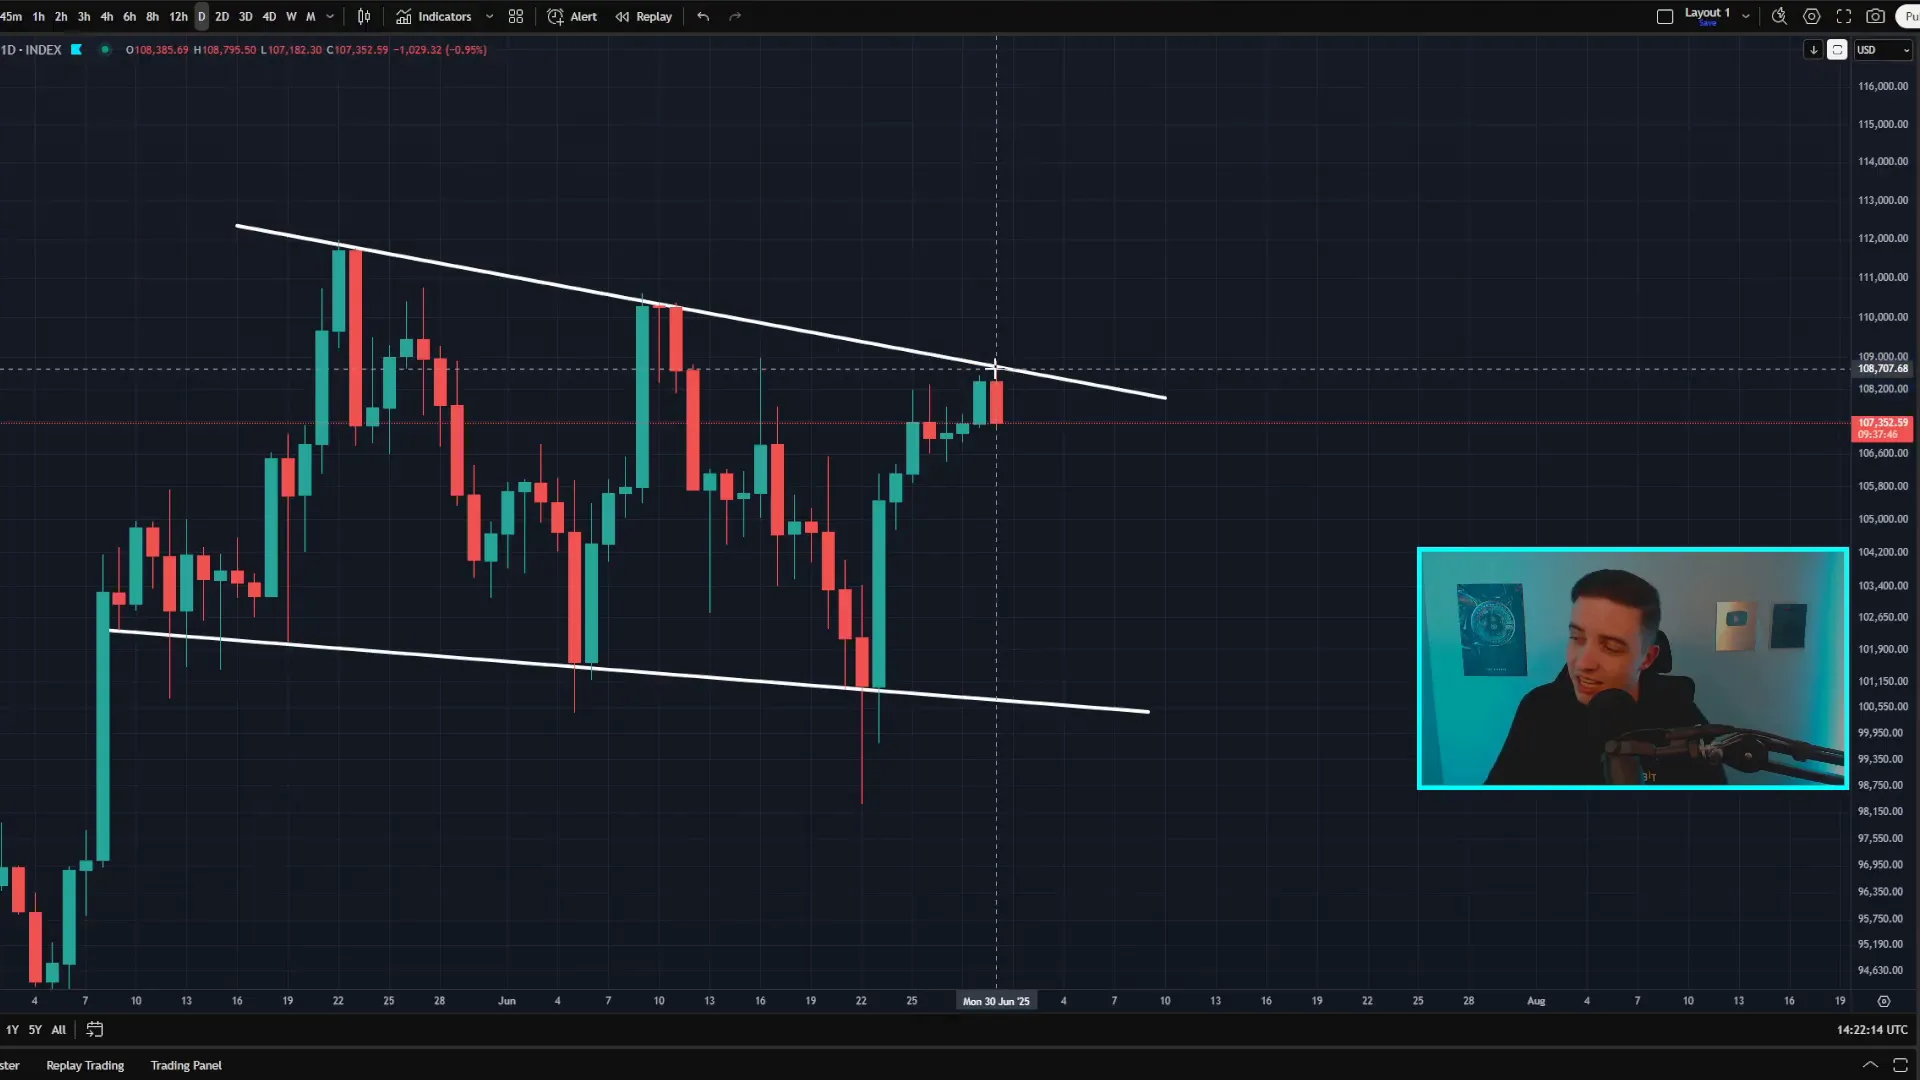
Key support remains just above $100,000, which continues to act as a critical floor in the market. Technically, Bitcoin is forming a falling wedge pattern—a bullish price pattern—but to confirm a breakout and validate bullish price targets, Bitcoin needs to close a daily candle above the descending resistance line, ideally above $109,000, and hold that level as new support.
Without this confirmation, the market could remain choppy and sideways. If Bitcoin fails to hold above $106,000 support, it could trigger a bearish move towards $103,500 to $104,000, which is the next significant support zone.
Liquidity analysis also shows a considerable amount of liquidity building just above the current Bitcoin price at around $109,000. This liquidity represents stop losses and buy orders clustered around this level, making it a natural price target for Bitcoin in the near term. However, the resistance line and liquidity cluster create a challenging barrier that Bitcoin must overcome to continue its ascent.
In summary, Bitcoin’s short-term price action is a delicate balance of support and resistance. The market is lacking momentum, and the likely scenario for the coming weeks is more sideways consolidation until a clear breakout or breakdown occurs.
Short-Term Bitcoin Price Levels to Watch
- Resistance: $108,500 - $109,000 (descending resistance line)
- Next resistance if breakout occurs: $110,000 - $110,500, then the all-time high near $112,000
- Support: $106,000 - $107,000 (recent resistance flipped to support)
- Next support if breakdown occurs: $103,500 - $104,000
Ethereum Price Outlook: Holding Key Levels Amidst Bearish Divergence
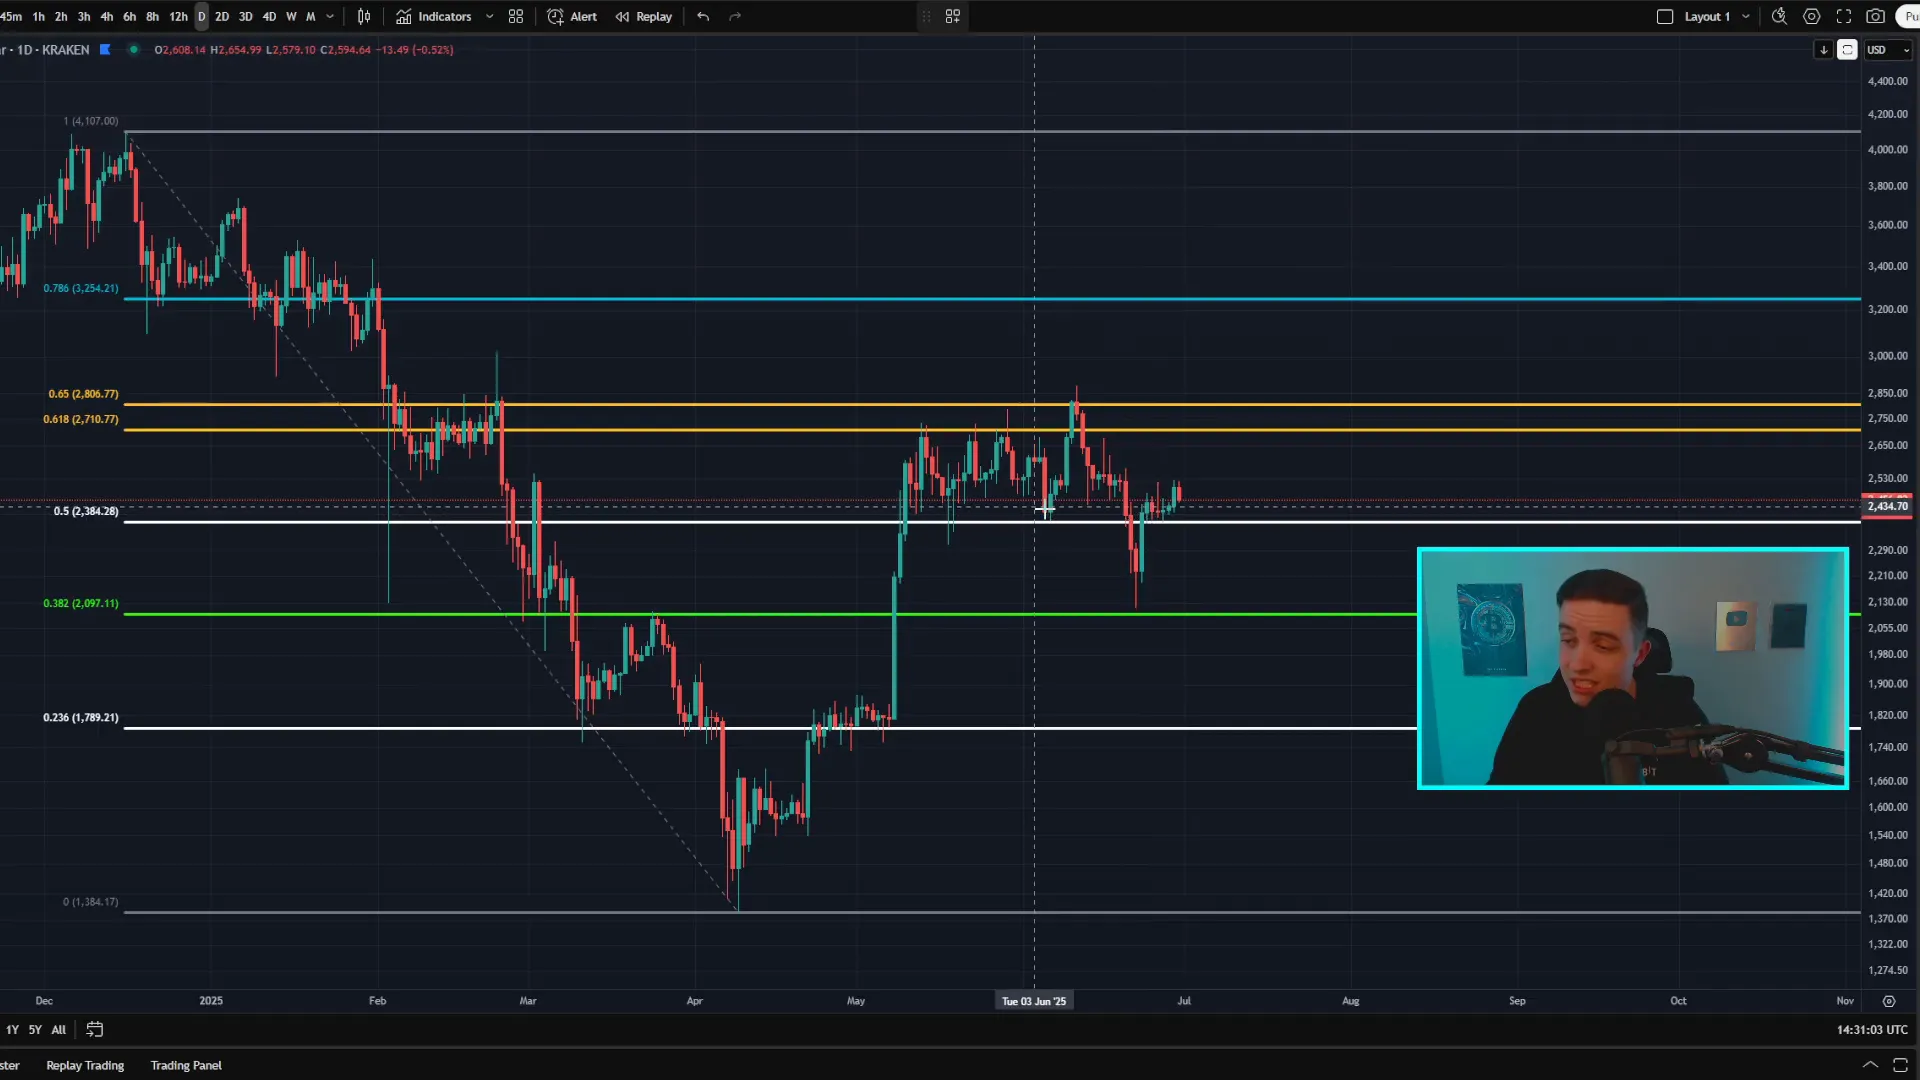
Ethereum, the second-largest cryptocurrency by market capitalization, is also navigating a critical juncture. On the daily time frame, Ethereum is holding above a key support zone near $2,380 to $2,390, which has proven resilient in recent trading sessions.
Ethereum recently attempted a slight bullish push but ran into significant resistance around the $2,500 mark, a level that has repeatedly tested Ethereum’s upside potential. Above this, resistance zones extend to roughly $2,510 to $2,520, and then higher resistance lies between $2,700 and $2,800.
Despite holding these supports, Ethereum faces a bearish divergence on the daily chart, where price is making higher highs, but momentum indicators like the RSI are making lower highs. This divergence signals weakening bullish momentum and suggests caution for traders expecting a strong upward surge.
This lack of momentum is consistent with Bitcoin’s sideways price action, as Ethereum and many altcoins tend to follow Bitcoin’s lead. If Bitcoin remains range-bound without strong momentum, Ethereum’s price is also likely to trade in a limited range with no significant breakout in the near term.
Ethereum Key Levels
- Resistance: $2,500, $2,510 - $2,520, $2,700 - $2,800
- Support: $2,380 - $2,390 (key daily support), $2,100 (major support if breakdown occurs)
Solana: Short-Term Bullish Relief Amidst Larger Bearish Context
Solana’s price action closely mirrors the cautious optimism seen in Ethereum. Recently, Solana broke above an important resistance zone between $143 and $146, which is positive news in the short term as this area now serves as support.
Currently, Solana is facing resistance near $154 to $155, which it is actively testing. Should it break this level, the next resistances lie at $158 and then a significant resistance zone near $167.
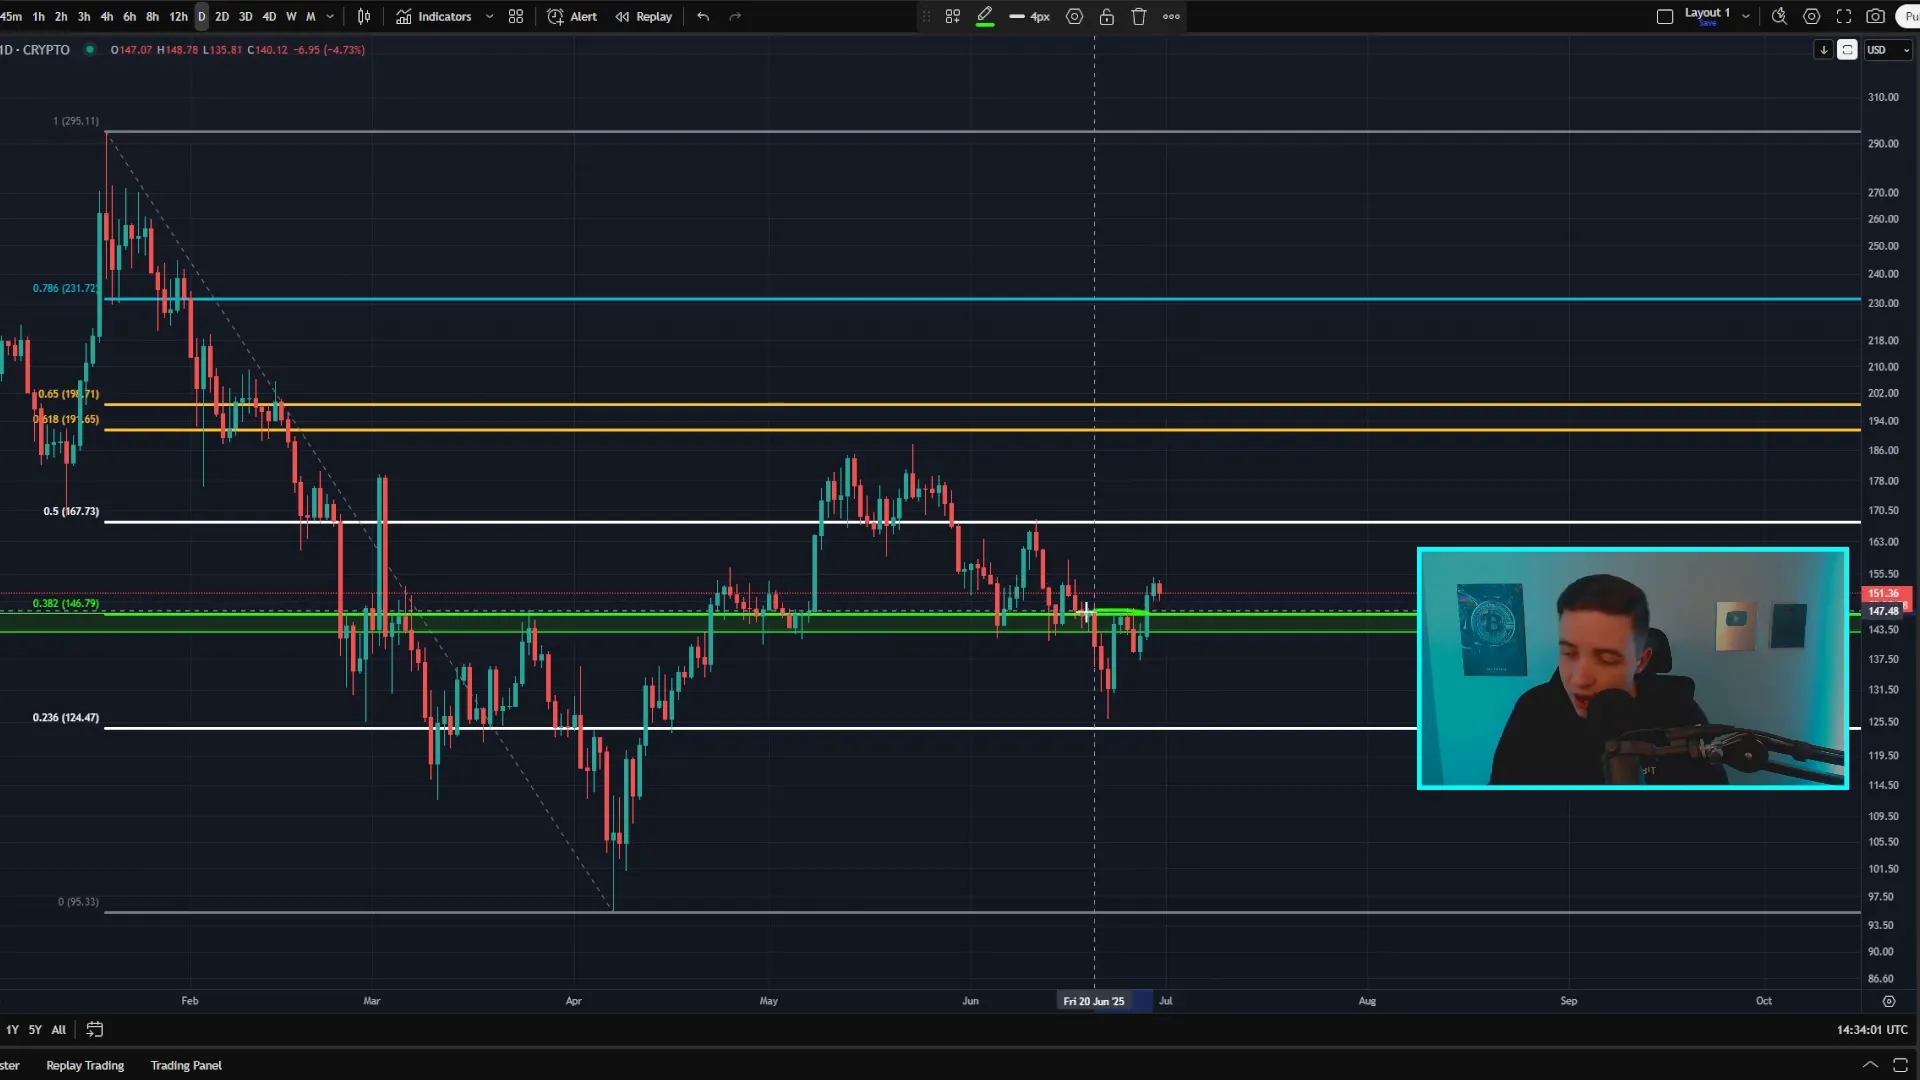
Given the recent breakout and support hold, Solana could see a mild bullish relief rally over the next few days or weeks. However, zooming out to the weekly or monthly charts reveals that the broader trend remains bearish until a clear reversal is confirmed.
So while the short-term outlook has some bullish flavor, traders should keep in mind that Solana’s larger price structure suggests caution. Like always, Bitcoin’s momentum will play a critical role in determining whether Solana and other altcoins can sustain upward moves or revert to bearish trends.
Solana Key Levels
- Support: $143 - $146 (recent breakout zone)
- Resistance: $154 - $155, $158, $167
XRP: Testing Resistance with Limited Momentum
XRP is currently grappling with resistance in the $2.19 to $2.20 range, a key Fibonacci level. Recently, XRP briefly closed just above $2.20 on the 12-hour chart—a classic “fakeout” scenario where the price momentarily breaks resistance but fails to sustain gains.
The very next candle closed back below this level, confirming the failure to break out decisively. XRP’s price action has remained neutral, bouncing sideways without clear bullish or bearish momentum.
For XRP to gain bullish traction, it must close and hold above this resistance zone, ideally flipping it into support. If successful, the next resistance targets would be around $2.25 and then a major resistance band between $2.31 and $2.35.
On the downside, support zones include $2.05 to $2.10 and a stronger support level at $1.92 to $1.95 should price fall below these ranges.
XRP Key Levels
- Resistance: $2.19 - $2.20, $2.25, $2.31 - $2.35
- Support: $2.05 - $2.10, $1.92 - $1.95
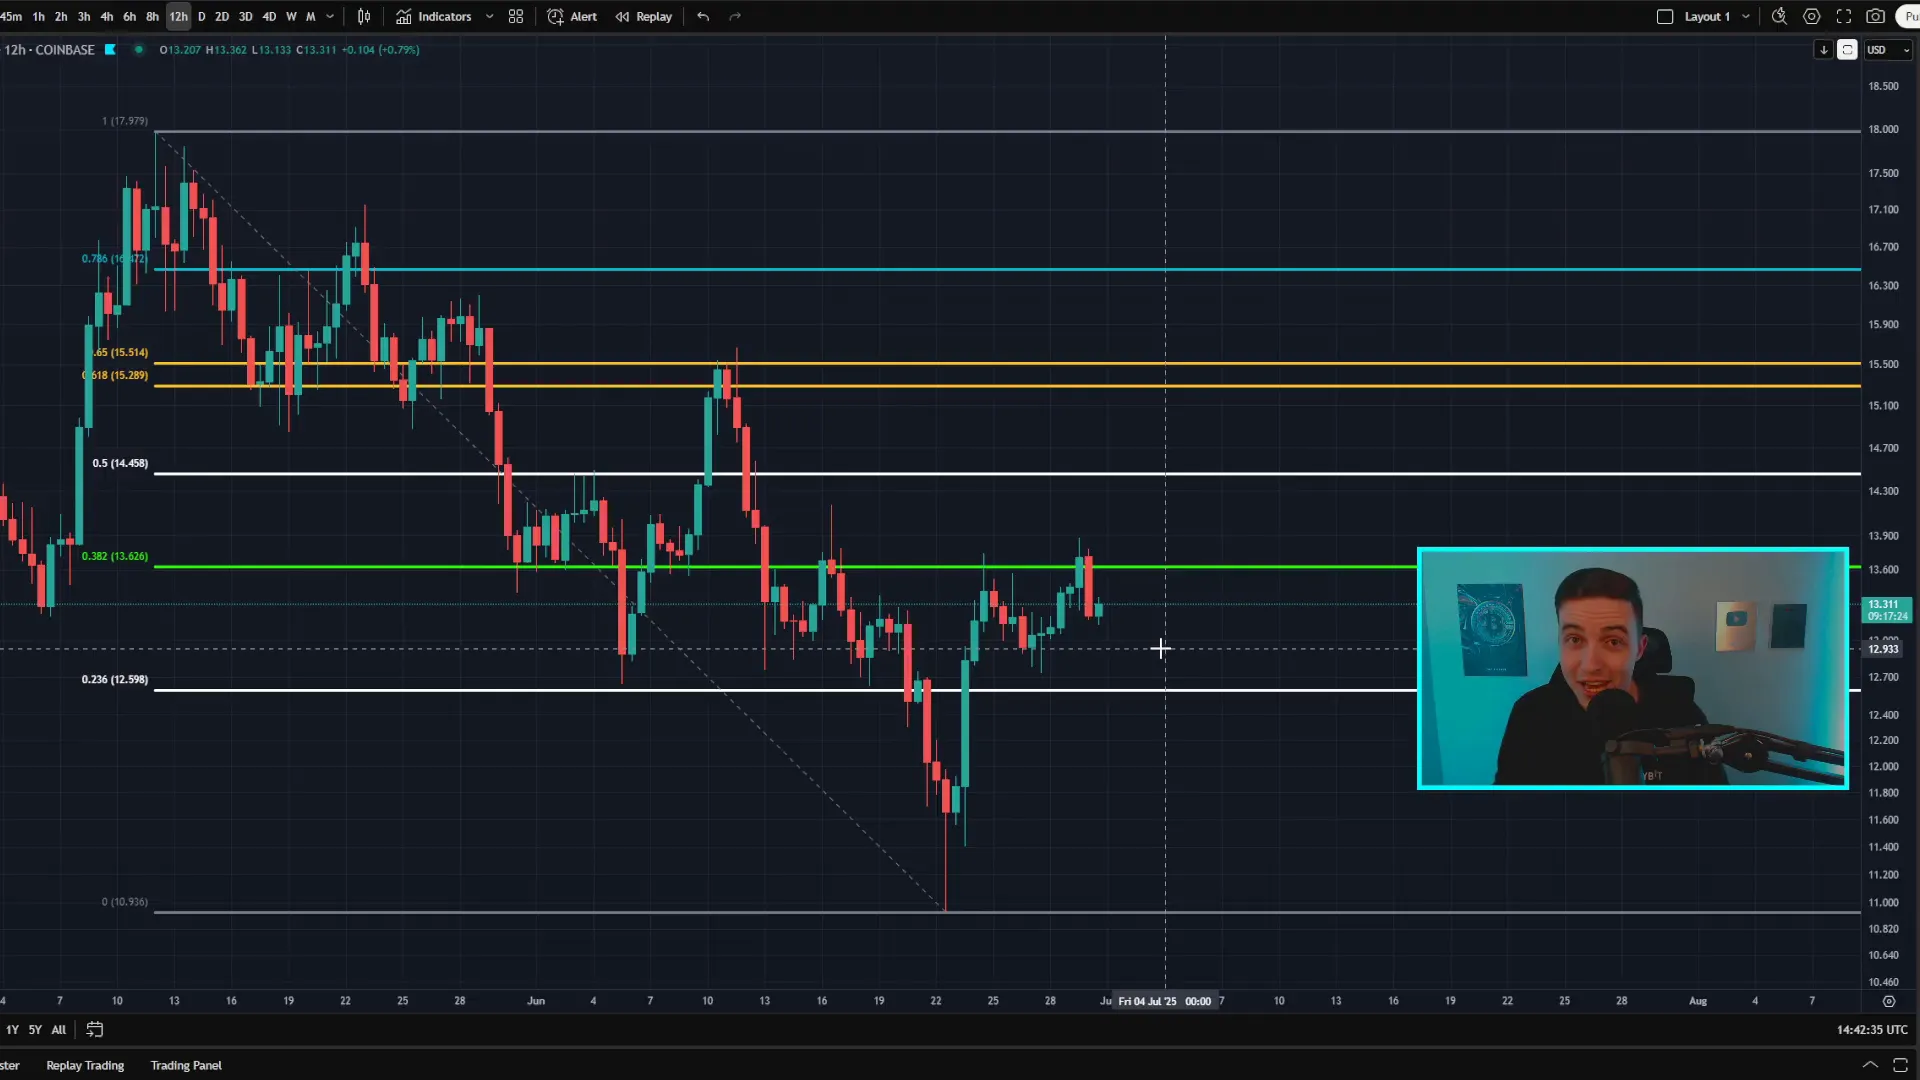
Chainlink: Slight Short-Term Bullishness Amid Larger Bearish Trend
Chainlink’s price action is somewhat similar to XRP and Solana. While the immediate short-term trend shows slight bullish signs—higher lows and higher highs—the broader trend remains bearish until a confirmed breakout occurs.
Chainlink recently experienced a fakeout above the key resistance zone between $13.60 and $13.70. The price briefly closed just above $13.70 but failed to hold, with the subsequent candle closing well below resistance, invalidating the breakout.
Resistance levels to watch include $13.60 to $13.70, $14.40 to $14.50, and a major resistance band between $15.30 and $15.50.
Given the lack of strong momentum and the significant resistance overhead, Chainlink is likely to experience only modest bullish relief in the short term rather than a strong upward rally.
Chainlink Key Levels
- Resistance: $13.60 - $13.70, $14.40 - $14.50, $15.30 - $15.50
- Support: To be watched as price action evolves
How to Navigate Sideways Market Conditions and Profit
With Bitcoin and many altcoins currently showing signs of limited momentum and trading in sideways ranges, many investors and traders might feel uncertain about how to approach the market. However, sideways or choppy markets present unique opportunities to capitalize on price fluctuations without needing a strong bullish or bearish trend.
Here are some strategies to consider during these periods:
- Range Trading: Identify key support and resistance levels and trade within the range. Buy near support and sell near resistance while setting appropriate stop losses.
- Scalping: Take advantage of small price movements by entering and exiting positions quickly, capitalizing on volatility within the range.
- Using Derivatives: Utilize options and futures contracts to hedge positions or speculate on price moves without holding the underlying asset.
- Liquidity Provision: For advanced traders, providing liquidity on decentralized exchanges can generate fees during sideways markets.
- Learning and Preparation: Use the consolidation period to deepen your understanding of crypto markets, develop new strategies, and prepare for the next big move.
For those interested in detailed guidance on profiting from sideways price action or trading bullish and bearish moves, there are numerous educational resources available that can help you master these approaches.
Final Thoughts on Bitcoin, Crypto, and Investing
The cryptocurrency market is currently at a pivotal moment. The aggressive accumulation of Bitcoin by major players like Strategy points toward a potential supply squeeze that could drive prices higher over the long term. However, in the short term, Bitcoin and many altcoins such as Ethereum, Solana, XRP, and Chainlink are navigating a phase of limited momentum and sideways trading.
Understanding key support and resistance levels, recognizing the impact of liquidity clusters, and monitoring momentum indicators are essential for making informed decisions. While the broader outlook remains bullish for long-term Bitcoin holders, short-term traders should adapt their strategies to the current market environment.
As always, risk management and thorough research are paramount. Crypto markets can be volatile and unpredictable, but with the right knowledge and preparation, you can navigate these waters and position yourself for success.
Stay informed, stay patient, and keep an eye on the evolving dynamics of Bitcoin, Crypto, BTC, Blockchain, CryptoNews, and Investing.
Bitcoin, Crypto, BTC, Blockchain, CryptoNews, Investing: Understanding the Impending Bitcoin Supply Squeeze and Market Momentum. There are any Bitcoin, Crypto, BTC, Blockchain, CryptoNews, Investing: Understanding the Impending Bitcoin Supply Squeeze and Market Momentum in here.

