
In today’s deep dive into the crypto space, we explore the latest price movements and technical setups for Bitcoin, Ethereum, Solana, XRP, and Chainlink. The market is currently in a phase of indecision and low momentum, but there are some critical levels and liquidity zones developing that traders and investors should watch closely. Whether you’re actively trading or looking to understand the broader crypto landscape, this comprehensive guide will walk you through the key price action and what to expect in the coming days and weeks.
Let’s break down the current state of the market, starting with the king of crypto — Bitcoin — and then moving through the altcoins that are shaping the narrative right now.
Bitcoin Price Analysis: Navigating Resistance and Liquidity Zones
Bitcoin is still battling a significant level of resistance while playing out a descending parallel channel on the daily timeframe. This setup has kept price action contained and momentum muted for now. Despite this, the larger timeframes suggest a continuing bull market, but the short term is showing signs of consolidation and uncertainty.
Weekly Timeframe: Bull Market but Losing Momentum
On the weekly chart, Bitcoin’s super trend indicator remains green, signaling that the broader bull market is still intact. However, bullish momentum has stalled somewhat. The price is making higher highs, but the Relative Strength Index (RSI) on the weekly chart is making lower highs — a classic bearish divergence.
This divergence suggests that while prices are inching higher, the underlying strength behind the move is weakening. It’s reminiscent of the market behavior around the same time last year, where a short-term cooldown occurred despite the broader uptrend.
Three-Day Timeframe: Cup and Handle Pattern in the Making
Zooming in to the three-day chart reveals a potential bullish price pattern: a cup and handle. This classic pattern often signals a continuation of an uptrend after a period of consolidation. The pattern has formed but is not yet confirmed.
For confirmation, Bitcoin needs to close a three-day candle above the breakout level near $110,000. This breakout would validate the pattern and could pave the way for a strong upward move. Until then, the pattern remains a possibility rather than a certainty.
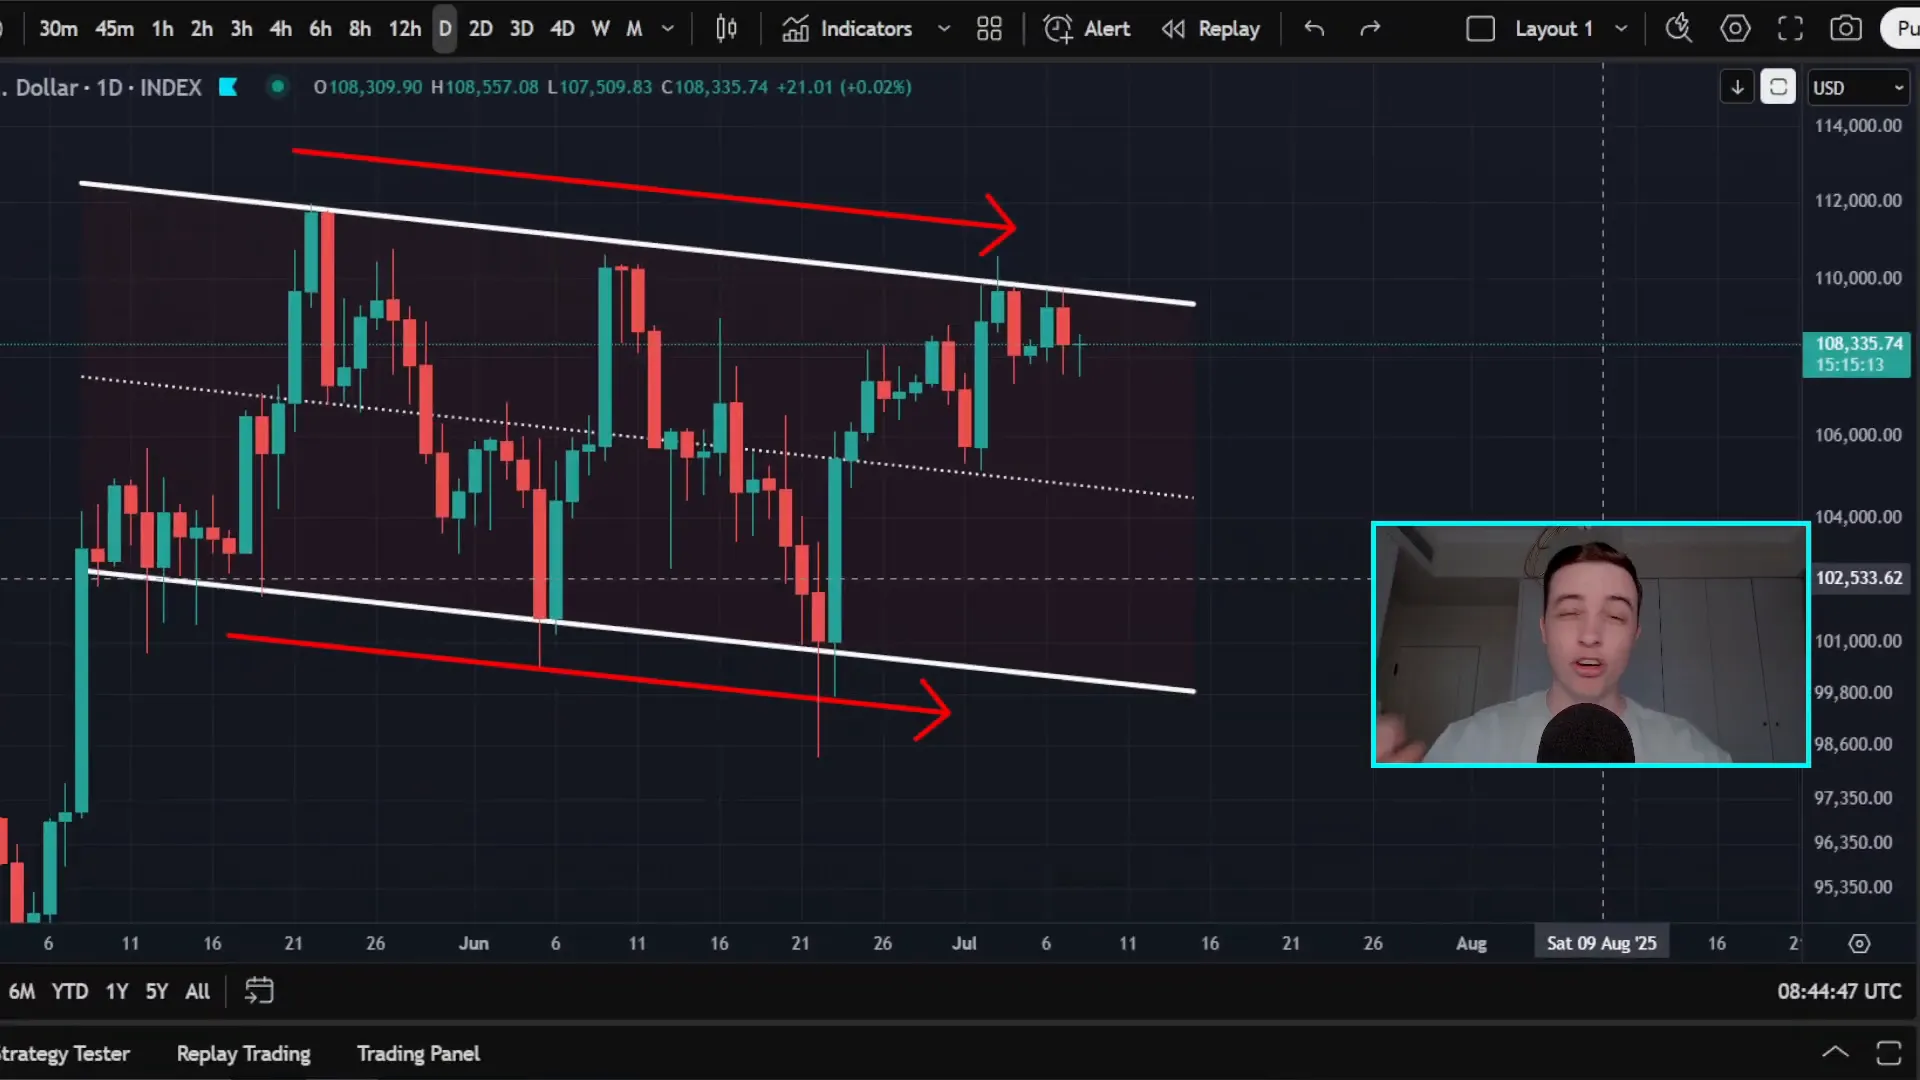
Daily Timeframe: Descending Parallel Channel and Key Support/Resistance
The daily chart shows Bitcoin trading within a descending parallel channel, bounded by a descending resistance line near $109,000 to $110,000 and a support line close to $100,000. This channel has confined price action for some time, with price bouncing between these lines.
Support levels to watch are around $98,000 and $103,000, while resistance is expected near $110,000 and the all-time highs close to $112,000. These levels are critical for traders looking for entries or exits in the short term.
Short-Term (6-Hour) Chart: Liquidity Building Below the Price
On the six-hour timeframe, Bitcoin has recently broken back below a previous support zone around $108,500 to $109,000, indicating this level is losing significance as support and is turning into resistance.
More importantly, there is a growing cluster of liquidity building below the current price, particularly between $106,700 and $107,000. This liquidity represents stop-loss orders and buy orders that could be targeted if Bitcoin dips into this zone.
It’s common in crypto markets for price to “take out” liquidity before making a decisive move. Therefore, it’s reasonable to expect Bitcoin to dip into this liquidity zone soon, potentially triggering stop losses before bouncing back up.
Once this liquidity is cleared, a bounce off this support zone could set Bitcoin up for a renewed attempt at breaking resistance and moving higher.
Trading Opportunities and Exchanges to Watch
Given the current lack of momentum but the presence of significant liquidity zones, traders should be ready for sudden moves. Setting up accounts on reliable crypto exchanges is essential to capitalize on these opportunities.
Exchanges like Betanex and Toobit offer no-KYC access from many countries, making it easier to trade quickly. Betanex, in particular, offers attractive bonuses for new users, including up to $45,000 in trading bonuses and deposit bonuses such as $200 for a $1,000 deposit. These incentives can provide extra capital for trading.
Remember to always check your local regulations before trading crypto on any platform.
Ethereum Price Analysis: A Sideways Shuffle
Ethereum is currently trapped in a sideways price range, bouncing between roughly $2,400 and $2,800. This range has held for over a month, reflecting a lack of momentum similar to Bitcoin’s current state.
Key support lies between $2,380 and $2,400, while resistance is expected between $2,700 and $2,800. A minor support level around $2,500 also offers a floor for short-term dips.
Given this prolonged sideways action, it’s reasonable to expect Ethereum to continue trading in this range unless Bitcoin breaks out decisively. The altcoin market often follows Bitcoin’s lead, so a breakout or breakdown in BTC could trigger a similar move in ETH.
Solana Price Analysis: Holding Key Support but Momentum Lacking
Solana is currently bouncing but remains above a critical support zone between $143 and $146. This support has been tested multiple times over recent weeks and months, proving its significance.
However, if Solana breaks and closes below $143, the next support levels to watch are between $138 and $139, followed by a local low between $126 and $132. This lower zone represents a more severe pullback if the support fails.
Resistance for Solana lies near $155 to $156, with a stronger resistance zone further up around $166 to $167.
Despite these bounces, Solana’s momentum remains weak, with no clear bullish thrust to drive prices higher in the near term.
XRP Price Analysis: Rising Wedge and Key Resistance Retest
XRP recently retested a significant resistance zone between $2.31 and $2.36. This retest was anticipated and resulted in a rejection, pushing the price back down.
The price is currently forming a short-term rising wedge pattern characterized by higher highs and higher lows. The support line of the wedge sits near $2.25, while resistance is around $2.34 to $2.35.
If XRP breaks below $2.25 with a confirmed close, the technical target based on the rising wedge pattern points to a drop toward approximately $2.09.
Before reaching this target, XRP may find short-term support around $2.20 and $2.17, which could slow or halt any declines.
Overall, XRP is showing slight bullish tendencies in the very short term but faces significant resistance overhead. Without stronger momentum from Bitcoin and the broader market, a breakout above this resistance looks unlikely for now.
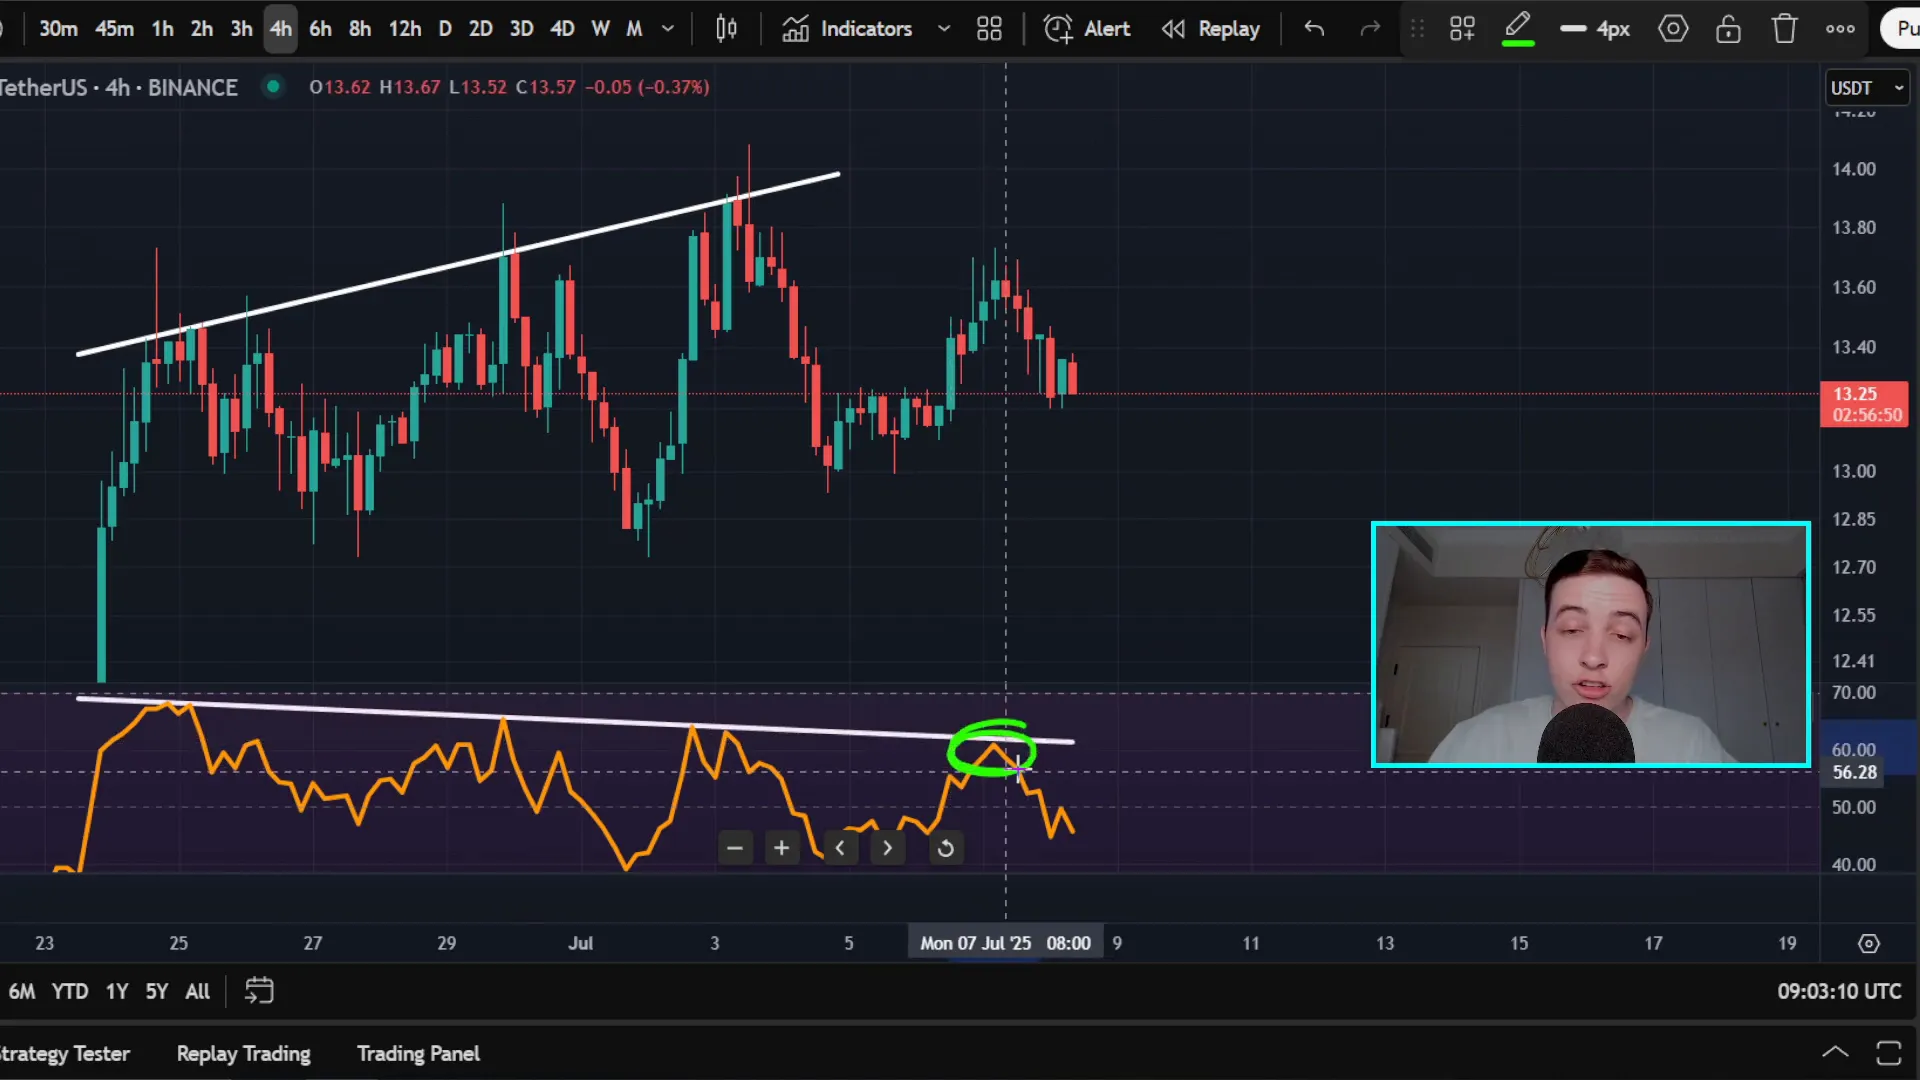
Chainlink Price Analysis: Sideways Consolidation Amid Bearish Divergence
Chainlink is also consolidating sideways on the twelve-hour timeframe, lacking momentum in either direction. This neutral price action is occurring within a larger bearish trend that has yet to be reversed.
Support for Chainlink is found between $12.60 and $12.80, with resistance between $13.60 and $13.90. There is also minor short-term support around $13.
Zooming into the four-hour chart, Chainlink’s RSI has recently rejected at a resistance level, reinforcing a bearish divergence that remains in play. This divergence suggests potential for a short-term pullback or continued sideways choppiness rather than an immediate bullish reversal.
A confirmed breakout above the RSI resistance line would invalidate the bearish divergence and could spark a bullish move, but until then, caution is warranted.
Key Takeaways for Crypto Traders and Investors
- Bitcoin is in a critical zone, battling resistance near $110,000 with liquidity building below near $106,700 to $107,000. Expect potential dips to take out liquidity before a possible bounce back up.
- Ethereum remains range-bound between $2,400 and $2,800, mirroring Bitcoin’s lack of momentum.
- Solana is holding important support around $143 to $146 but lacks strong bullish momentum.
- XRP is forming a rising wedge near resistance and may retest $2.31 to $2.36 again before deciding its next move.
- Chainlink shows bearish divergence in RSI and is consolidating sideways within a larger downtrend.
For traders, this environment calls for patience and readiness. The market is primed for a potential shakeout to grab liquidity before making a decisive move. Having accounts on exchanges like Betanex and Toobit, which offer no-KYC access and generous bonuses, can provide the flexibility to trade quickly when opportunities arise.
Remember, crypto markets can shift rapidly. Staying informed and prepared is key to navigating these turbulent waters.
How to Prepare for the Next Move in Bitcoin and Crypto Markets
Given the current technical setups, here are some strategic tips to help you navigate the market:
- Watch Key Levels: Keep an eye on Bitcoin’s support near $106,700 and resistance near $110,000 to $112,000. These levels will guide the next big moves.
- Monitor Liquidity Zones: Liquidity clusters often act as magnets for price action. Expect tests of these zones before strong trends develop.
- Follow Momentum Indicators: RSI divergences and patterns like rising wedges provide clues about potential reversals or continuations.
- Align Altcoin Trades with Bitcoin: The altcoin market tends to follow Bitcoin’s lead. Confirm Bitcoin’s direction before committing heavily to altcoin trades.
- Use Exchanges with Fast Access: Platforms like Betanex and Toobit allow you to enter and exit trades quickly without lengthy KYC processes.
- Stay Educated: Continuously update your technical analysis skills and market knowledge to adapt to changing conditions.
By following these guidelines, you can position yourself to take advantage of the next major price moves in Bitcoin, Ethereum, and other key cryptocurrencies.
Bitcoin, Crypto, BTC, Blockchain, and CryptoNews are evolving rapidly. The current market phase is one of consolidation and preparation, where the next big move is being set up behind the scenes. Whether you’re a trader or a long-term investor, understanding these technical dynamics will help you make more informed decisions and seize opportunities as they arise.
Stay tuned, stay prepared, and keep your eyes on the charts — the crypto market’s next chapter is just around the corner.
Bitcoin, Crypto, BTC, Blockchain, and CryptoNews: What’s Next for the Market?. There are any Bitcoin, Crypto, BTC, Blockchain, and CryptoNews: What’s Next for the Market? in here.

