
Welcome to an in-depth exploration of the current state of the cryptocurrency market, focusing on Bitcoin, Ethereum, Solana, XRP, and Chainlink. As the crypto world evolves rapidly, staying informed about market trends, technical analysis, and trading strategies is essential for both seasoned investors and newcomers alike. This analysis dives into recent price actions, technical indicators, and key resistance and support levels, offering valuable insights to help you make smarter investment decisions.
The crypto market has been buzzing with activity, and Bitcoin, the flagship cryptocurrency, is at a crucial juncture. We’re witnessing a potential breakout from a significant price pattern, while altcoins like Solana are confirming bullish moves, and XRP and Chainlink are testing critical resistance levels. Understanding these dynamics can position you better for the next wave of opportunities in the crypto space.
Understanding Bitcoin’s Current Market Position
Bitcoin’s price action is currently showing signs of hesitation near a critical resistance area after recently pushing towards a major liquidity zone. Liquidity zones are areas where many stop orders and limit orders accumulate, often acting as magnets for price action. Bitcoin’s proximity to this liquidity suggests the market is gearing up for a potential breakout or a significant move.
Weekly Bitcoin Price Chart: A Bullish but Cautious Outlook
Analyzing Bitcoin on the weekly time frame reveals a mixed but cautiously optimistic picture. The super trend indicator remains green, signaling the persistence of a larger bull market. However, the MACD indicator shows only a slight gain in bullish momentum, indicating that while the bulls are present, they have not yet fully dominated the market.
The price itself is making higher highs, which is a bullish sign, but the Relative Strength Index (RSI) is displaying lower highs, creating a bearish divergence. This divergence suggests that despite higher prices, the momentum behind those gains is weakening, often a precursor to a slowdown or correction in price.
This bearish divergence does not rule out further upside moves, though. If Bitcoin manages to break above its previous all-time high, it could temporarily invalidate this bearish signal, potentially leading to another leg up. However, traders should remain vigilant, as a renewed bearish divergence could form in the coming weeks or months if RSI fails to break higher.
Three-Day Bitcoin Chart: Approaching a Bullish Crossover
Zooming into the three-day chart, Bitcoin is nearing a potential bullish crossover in the MACD indicator. A bullish crossover occurs when the MACD line crosses above the signal line, signaling increasing bullish momentum. Confirmation of this crossover in the coming days could mark the start of a renewed upward trend.
While the signs are promising, confirmation is still pending. If the MACD histogram begins to expand upward quickly, mimicking previous bullish surges, it would reinforce this positive outlook. Until then, the market remains on edge, waiting for a clear signal.
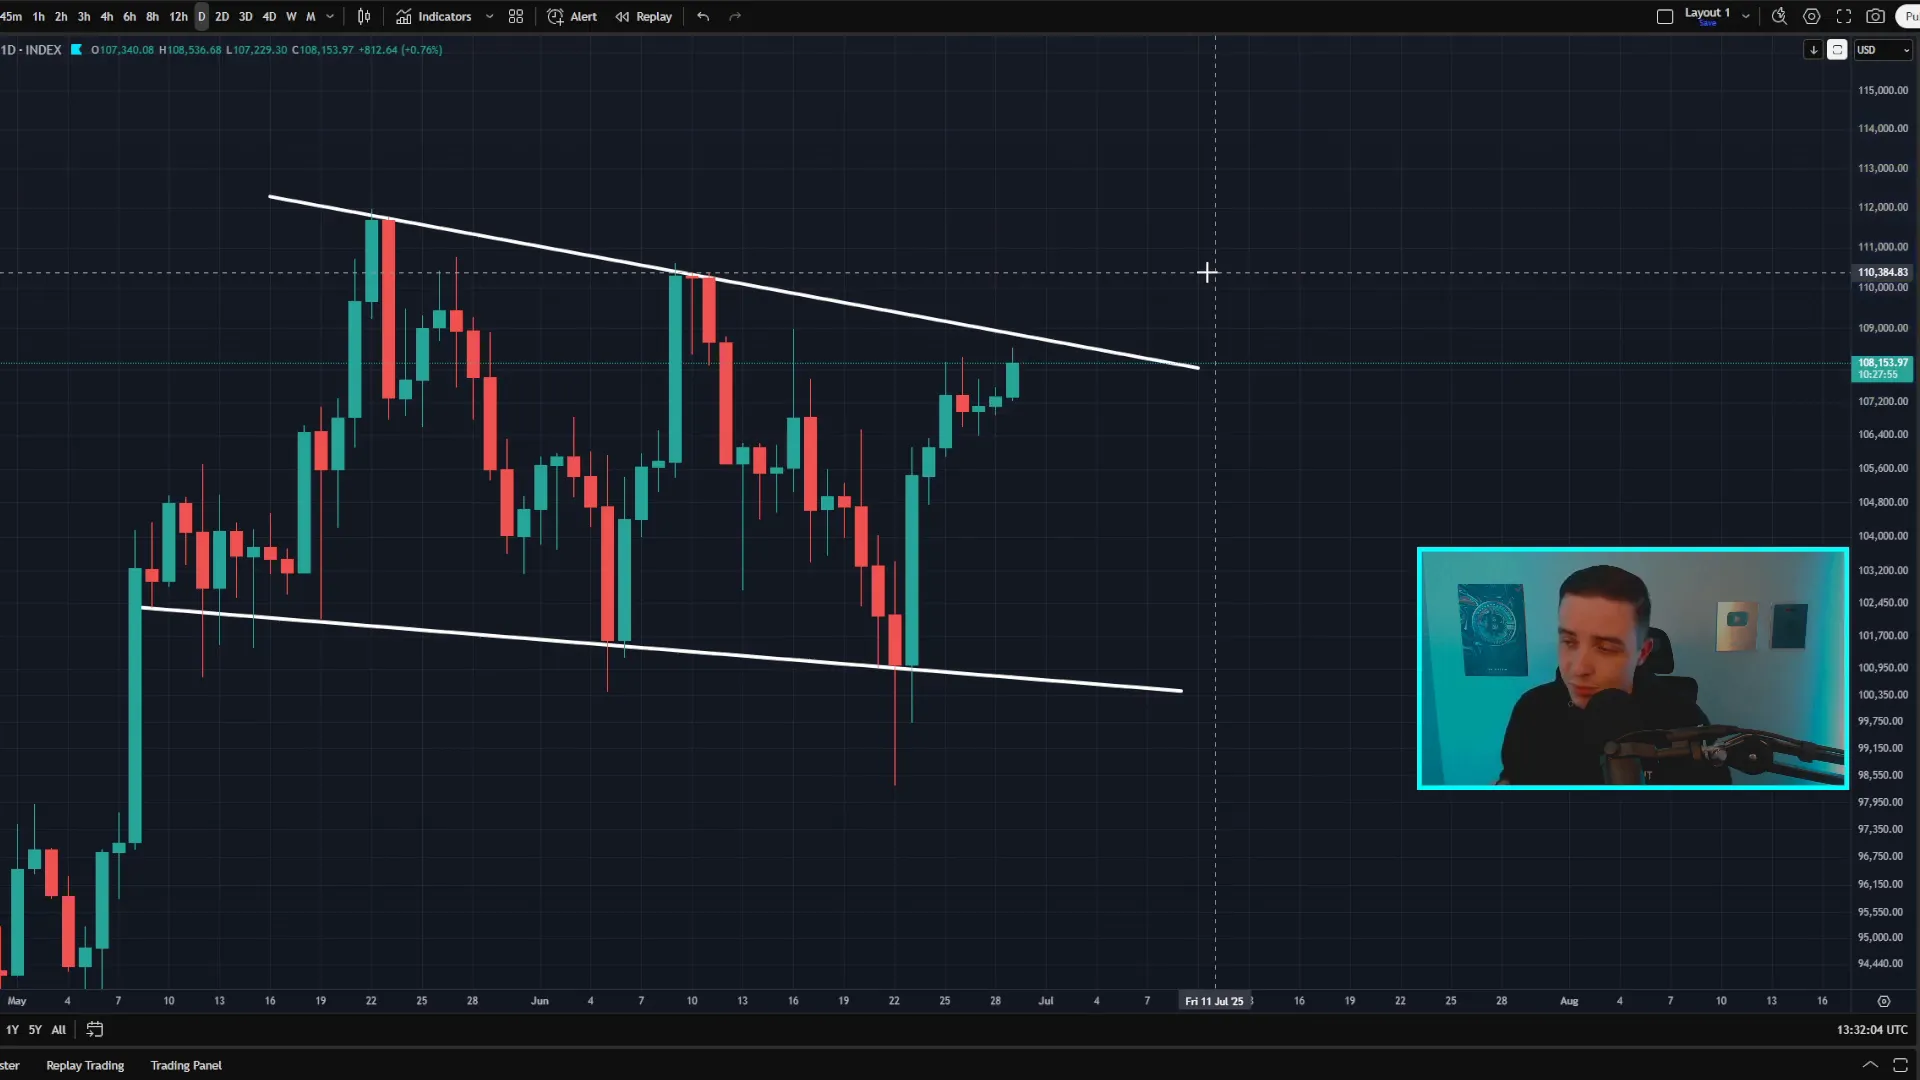
Daily Bitcoin Chart: The Falling Wedge Pattern and Breakout Targets
On the daily chart, Bitcoin is forming a large falling wedge pattern—a technical formation often associated with bullish reversals. The support line of this wedge lies between $100,000 and $101,000, while the resistance line sits just below $109,000.
For a confirmed breakout, Bitcoin must close a daily candle above the $109,000 resistance. Upon breakout confirmation, there are two key price targets to watch:
- First target: The top of the wedge near the previous all-time high, approximately $111,500 to $112,000.
- Second target: A measured move target around $119,000, representing a roughly 9-10% move from the breakout level.
These targets provide a framework for traders planning breakout strategies. For example, entering a long position post-breakout, taking partial profits near the first target, and riding the remaining position towards the second target while adjusting stop-loss levels to lock in profits. It’s important to remember, however, that these targets are theoretical until the breakout is confirmed.
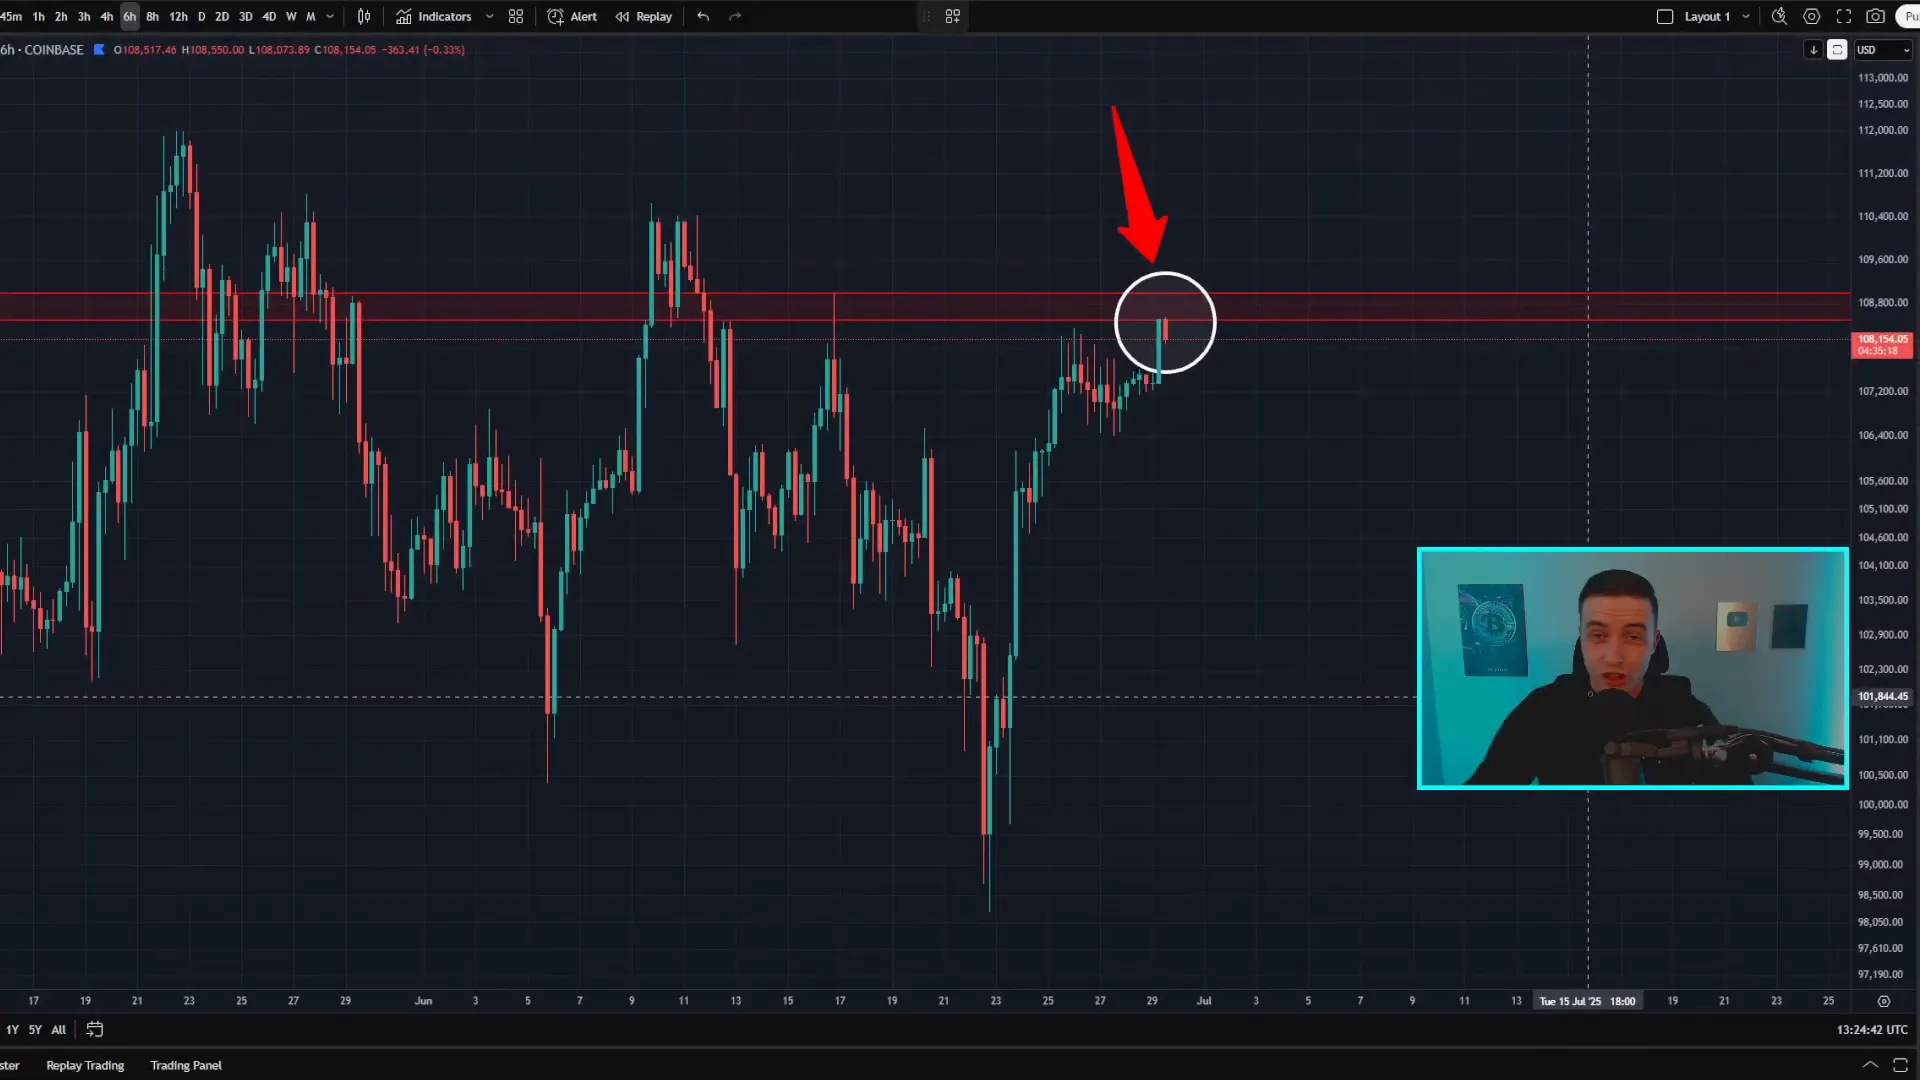
Short-Term Support and Resistance Levels
In the shorter term, Bitcoin’s price is currently struggling near $108,500 to $109,000, a key resistance zone. This follows a solid bounce from support around $106,000 to $107,000, which has held firm so far.
If the $106,000 support breaks, expect further support between $103,500 and $104,000. On the resistance side, beyond $109,000, the next hurdles are between $110,000 and $110,500.
Notably, an inverse head and shoulders pattern, often a bullish reversal signal, was previously considered on the six-hour chart but has lost validity due to price action failing to form a clear right shoulder.
Overall, the short-term momentum is slowly shifting bullish, with higher lows and higher highs beginning to form. However, a significant move upward is unlikely until the $109,000 resistance is decisively broken.
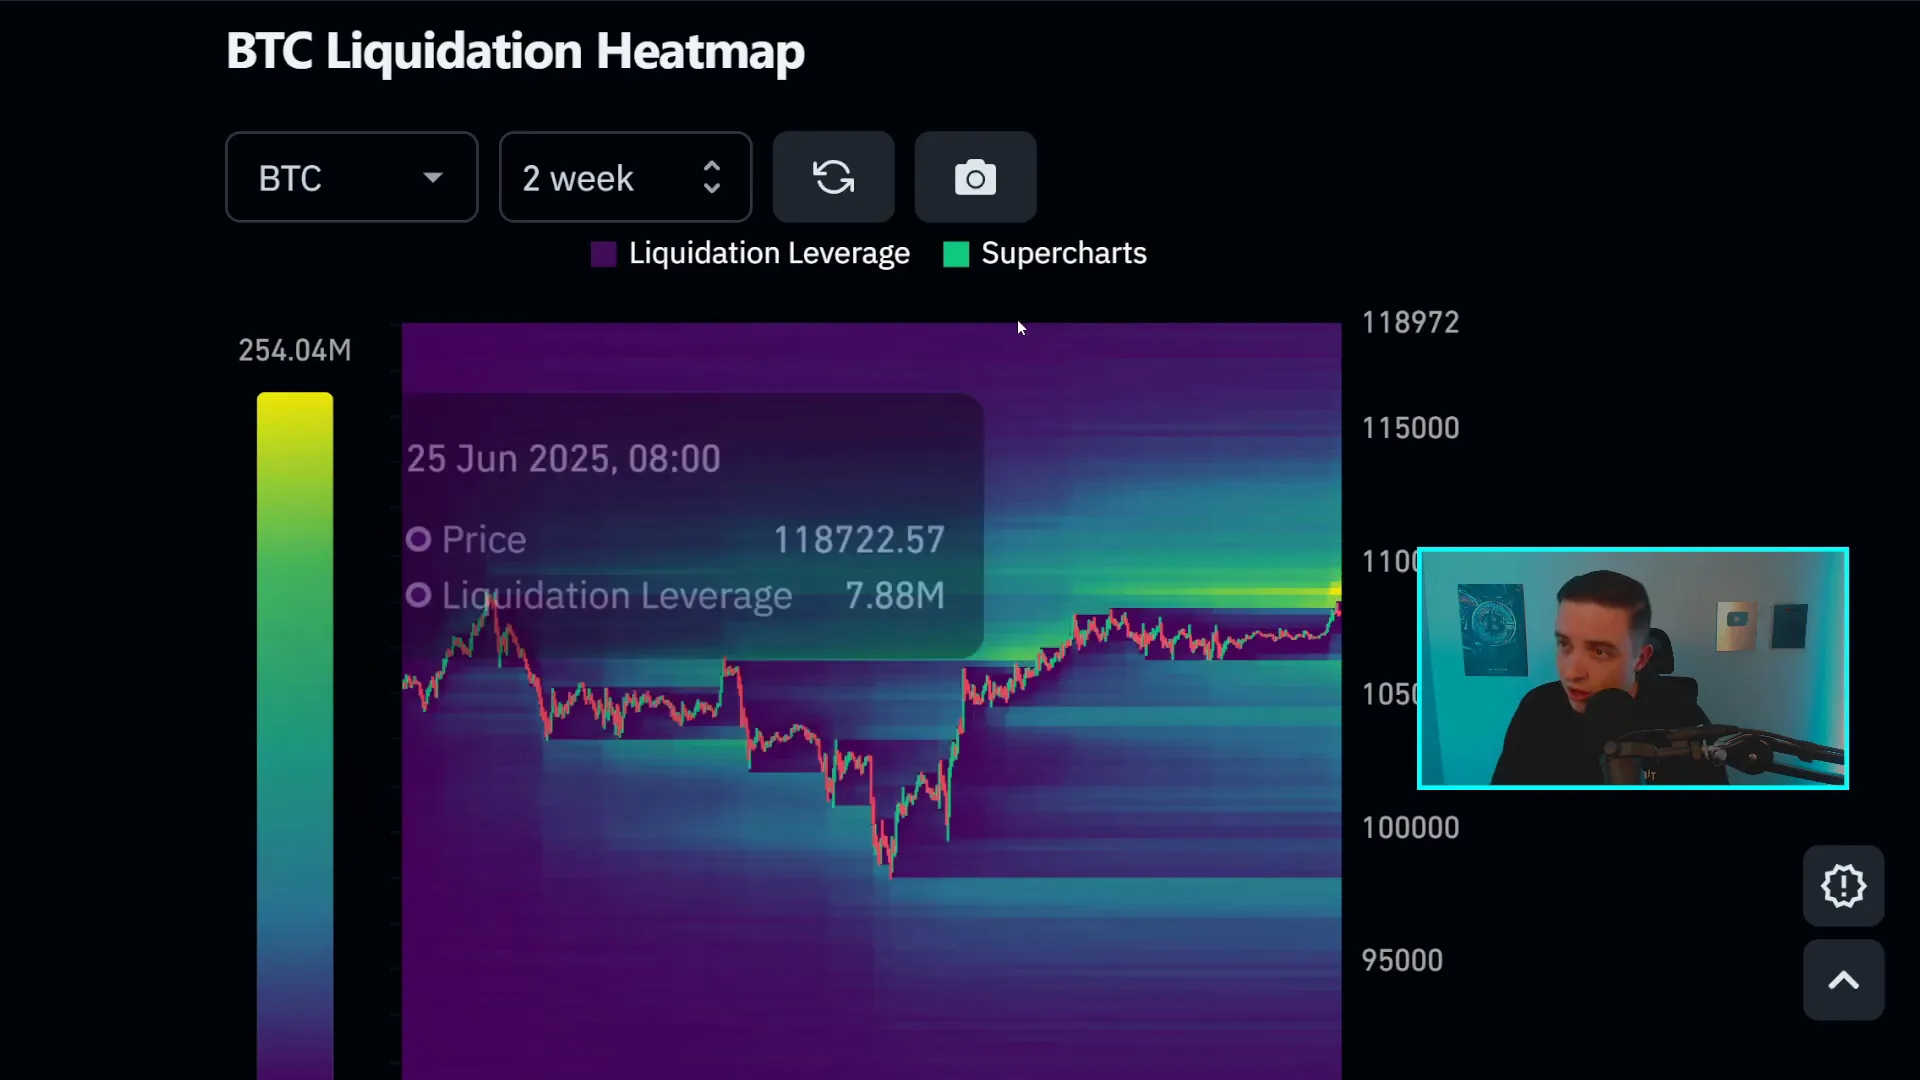
Bitcoin Liquidity Heat Map: Why It Matters
One of the reasons Bitcoin has been moving towards the $109,000 level is liquidity accumulation—areas where many traders have placed orders. Price often gravitates towards these liquidity pools to trigger stop losses and take out orders, clearing the path for further moves.
Previously, liquidity below the price led to a short-term dump when taken out, while recent bullish moves targeted liquidity above the price. Currently, liquidity at $109,000 is acting like a magnet, pulling Bitcoin upwards but also encountering resistance as it approaches.
Ethereum: Stability Amidst Bearish Divergence
Ethereum’s price movement is largely influenced by Bitcoin’s trends but has its own unique technical considerations. On the daily chart, Ethereum has bounced off a critical retracement support level near $2,390, just under the $2,400 mark.
If Ethereum falls below this support, the next significant support lies around $2,100, which is also where the recent bounce took place. On the upside, resistance appears at $2,500, with major resistance zones between $2,700 and $2,800.
Technically, Ethereum is still grappling with an active bearish divergence on its daily RSI, signaling a lack of bullish momentum. This divergence has not yet been invalidated, meaning Ethereum may continue to face sideways or downward pressure until a clear breakout above resistance occurs.
Given Ethereum’s close correlation with Bitcoin, any bullish momentum in Bitcoin could spill over to Ethereum, providing short-term relief. However, the bearish divergence suggests caution as Ethereum may remain range-bound in the near term.
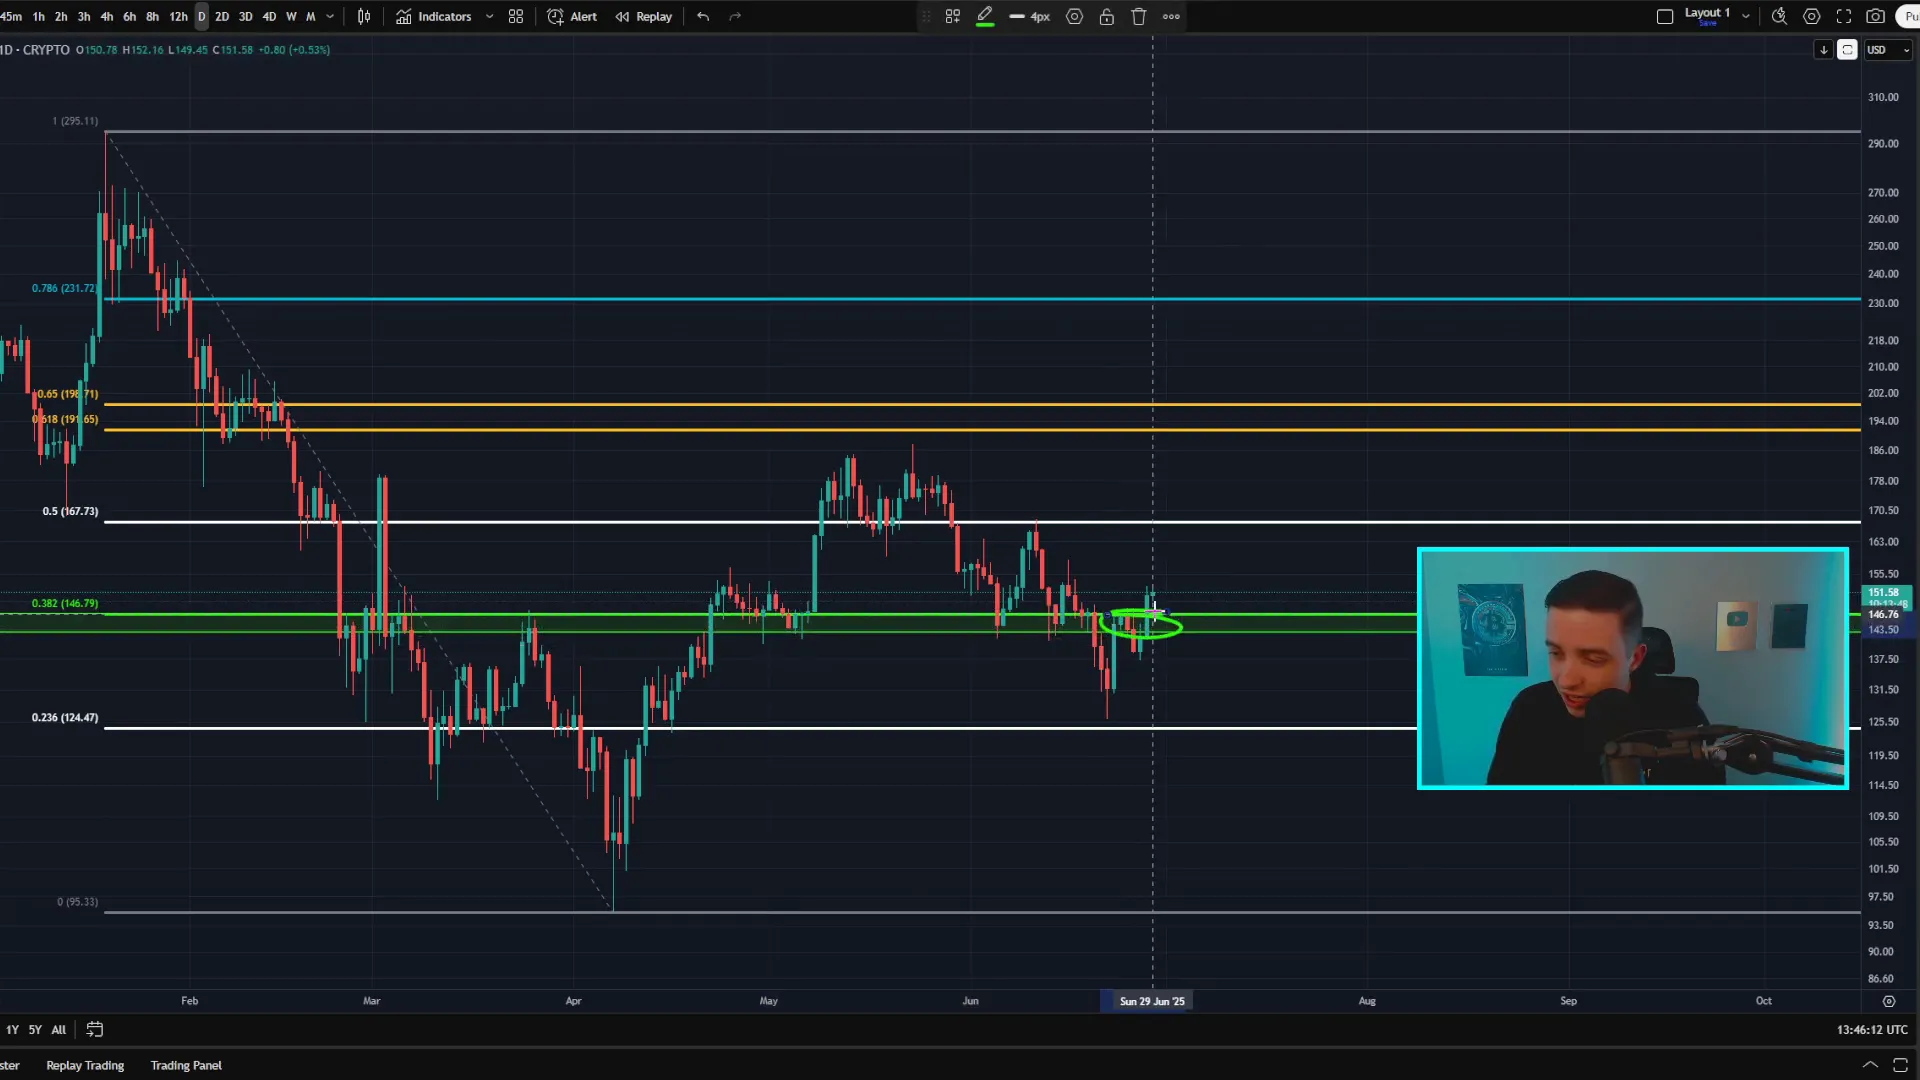
Solana: Confirming a Bullish Breakout
Solana has recently delivered a notable bullish signal by confirming a breakout above a critical resistance zone between $143 and $146. The daily candle closed near $150, marking the first confirmed close above this level in some time.
This breakout is significant because this price band has historically acted as both resistance and support, making it a pivotal zone for Solana’s price structure. Holding this area as new support would signal a potential shift from a bearish to a bullish trend on the daily chart.
For further confirmation, traders should watch for a retest of this breakout zone, which would solidify the support. The next levels of resistance to monitor are approximately $154, followed by $158, and a major resistance near $167.
Additionally, there is a possible inverse head and shoulders pattern in formation. This pattern, if confirmed by price action breaking above resistance around $167, would be a powerful bullish indicator with solid price targets. However, this pattern is still in progress and not yet confirmed, so caution is warranted.
XRP: Testing Resistance and Awaiting Direction
XRP is currently testing a crucial resistance level between $2.19 and $2.20 on the 12-hour chart. This level has proven difficult to breach recently, with price rejections occurring near this zone.
If XRP manages to close candles decisively above $2.20 and maintain this level as support, the next resistance targets are around $2.25, with major resistance between $2.30 and $2.35.
On the downside, XRP finds solid support between $2.05 and $2.10, with a critical support level at $2.07. The immediate price structure appears neutral, caught in a sideways range with no clear bullish or bearish momentum dominating.
This sideways movement suggests that XRP could continue to consolidate for the next few days or weeks. However, XRP’s price is heavily influenced by Bitcoin’s performance. If Bitcoin struggles at resistance or experiences a pullback, XRP is likely to follow suit. Conversely, a Bitcoin breakout would likely propel XRP higher.
Chainlink: Sideways Momentum and Pattern Watch
Chainlink is exhibiting similar behavior to XRP, trading in a sideways range after a recent bounce from local lows on the 12-hour chart. Key resistance lies between $1,360 and $1,370, while support is strong between $1,260 and $1,280.
Traders should watch for a breakout above $1,370 to confirm a potential inverse head and shoulders pattern. For this pattern to be valid, Chainlink needs to break out within the next couple of days, as prolonged sideways movement would invalidate the pattern.
Currently, Chainlink lacks strong momentum in either direction. The overall longer-term trend remains bearish, but short-term price action could continue to fluctuate sideways.
Preparing for the Next Trading Opportunity
Given the current market conditions, it’s essential to be prepared for the next significant move in Bitcoin and altcoins. This period of consolidation and testing of key levels is a critical setup phase. Traders should watch for breakouts or breakdowns from these important resistance and support zones to capitalize on new trends.
For those actively trading, using exchanges that offer robust tools and attractive bonuses can enhance your trading experience. Platforms like BTNX and 2Bit provide no-KYC access and lucrative bonuses for new traders, making them worth considering for your crypto trading activities.
Remember, no matter the direction of the market, there are strategies to profit. Whether you prefer trading bullish breakouts, shorting during bearish moves, or capitalizing on sideways price action, understanding and adapting to market conditions is key.
Final Thoughts on Navigating the Crypto Market
The cryptocurrency market is currently in a dynamic phase, with Bitcoin approaching critical resistance, Ethereum stabilizing amid bearish signals, Solana confirming bullish momentum, and XRP and Chainlink testing key levels. Each asset presents unique opportunities and risks, emphasizing the importance of technical analysis and market awareness.
Staying informed about liquidity zones, support and resistance levels, and technical patterns can significantly improve your trading and investment decisions. Always prepare for multiple scenarios and manage risk carefully, especially in a market as volatile as crypto.
Whether you’re holding Bitcoin, trading altcoins, or exploring new blockchain opportunities, understanding these market dynamics helps you avoid traps and capitalize on potential gains. Keep a close eye on Bitcoin’s breakout confirmation, as it often sets the tone for the broader crypto market.
Invest wisely, stay patient, and be ready to act when the market provides clear signals.
Bitcoin, Crypto, BTC, Blockchain, and CryptoNews: Navigating the Latest Market Movements and Investment Insights. There are any Bitcoin, Crypto, BTC, Blockchain, and CryptoNews: Navigating the Latest Market Movements and Investment Insights in here.

