Bitcoin, Crypto, BTC, Blockchain, CryptoNews, Investing—these terms are buzzing louder than ever as Bitcoin hits critical price targets and the crypto market braces for potential massive moves. If you’ve been tracking the crypto space, you’ll know that Bitcoin's recent breakout has set the stage for some exciting opportunities not just in BTC but also in major altcoins like Ethereum, Solana, XRP, and Chainlink.
In this deep dive, we’ll explore the latest technical analysis, trading strategies, and price targets across these cryptocurrencies. Whether you’re a swing trader or a long-term investor, understanding these patterns and market signals can help you position yourself for potential gains in the weeks and months ahead.
Bitcoin Weekly and Three-Day Chart Analysis: Bullish Signals and Key Price Targets
Starting with Bitcoin’s weekly price chart, the super trend indicator remains green, signaling that the larger bull market is still intact. The weekly Bitcoin MACD (Moving Average Convergence Divergence) also supports this bullish outlook, remaining in the green zone without any bearish crossovers. While the bullish momentum isn’t as strong as in previous surges, such as the highs seen in late 2024, it remains more bullish than bearish—a crucial factor for those eyeing continued upward price movement.
However, there is a potential bearish divergence looming. If Bitcoin forms a new higher high but the Relative Strength Index (RSI) fails to confirm with a corresponding higher high—especially compared to the December 2024 peak—this divergence could signal a cautionary note. But for now, as Bitcoin attempts a breakout into new all-time highs, this bearish divergence is temporarily invalidated.
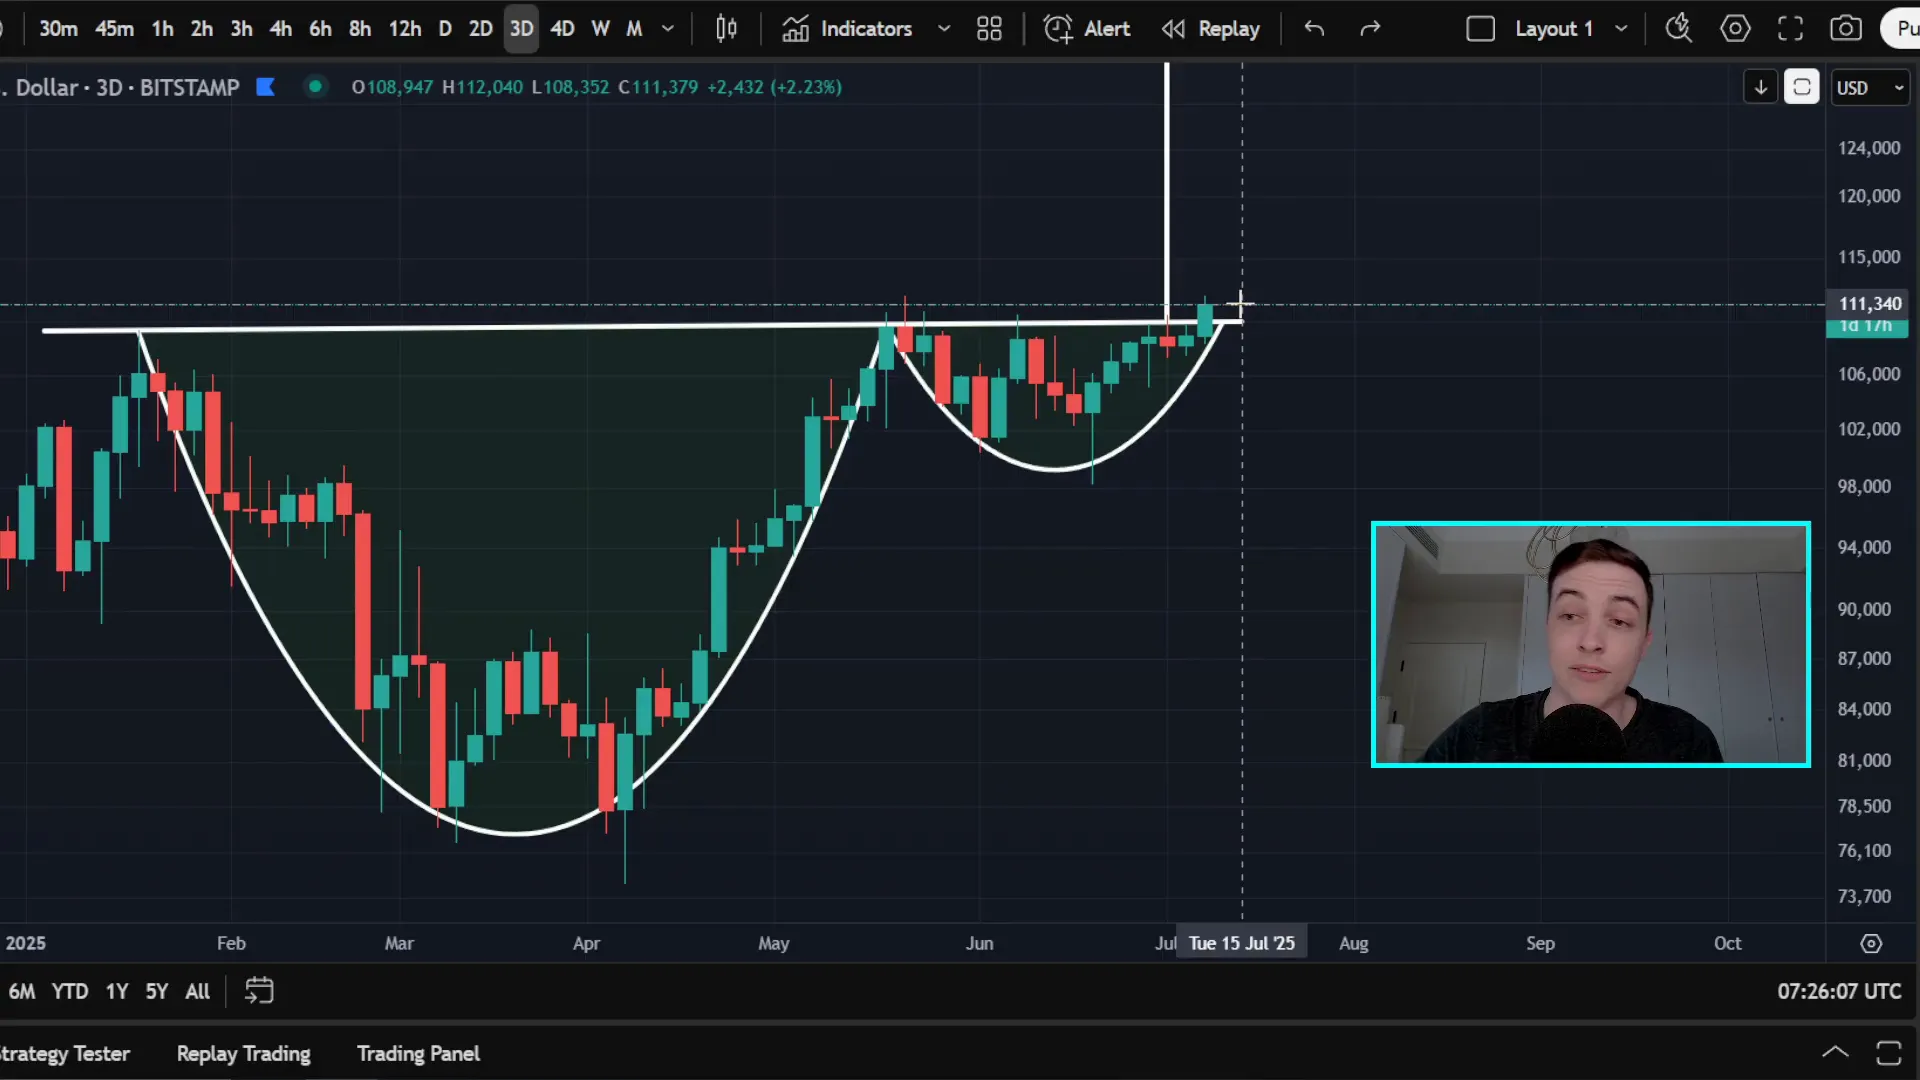
Zooming into the three-day timeframe reveals a more actionable setup. Bitcoin is currently testing a massive cup and handle pattern, one of the most reliable bullish price patterns in technical analysis. The breakout confirmation hinges on a three-day candle close above the neckline around $110,000. As of now, Bitcoin is hovering near $111,000, with the next candle close in about one and a half days expected to be decisive.
Should Bitcoin hold above $110,000–$111,000, this breakout would set a substantial price target near $153,000. This represents nearly a 40% move from the breakout point without leverage. For traders using leverage, say 10x, this could translate into gains approaching 400%—though, of course, leverage carries significant risk and should be used cautiously.
It’s important to stress that price movements rarely go straight up. Expect resistance levels and potential pullbacks along the way. A prudent approach involves setting a stop loss just below the breakout point to minimize losses if the breakout fails. As the trade moves into profit territory, moving the stop loss to lock in gains is a wise risk management strategy.
Daily and Short-Term Bitcoin Price Structure
On the daily chart, Bitcoin recently confirmed a breakout above a descending resistance line within a descending parallel channel. This breakout, confirmed by a daily candle close just above $111,000, signals a significant shift in the short-term price structure. Previously, Bitcoin had been consolidating sideways with a slight downward bias, but this breakout suggests momentum is swinging bullish.
This resistance line, now flipped to support, sits near $109,500. Additional support zones exist around $105,500 and $103,000, providing potential safety nets if the price retraces. The next key resistance to watch is the previous all-time high at approximately $112,000. Breaking above and closing above this level would confirm new all-time highs and open the path toward the larger targets discussed earlier.
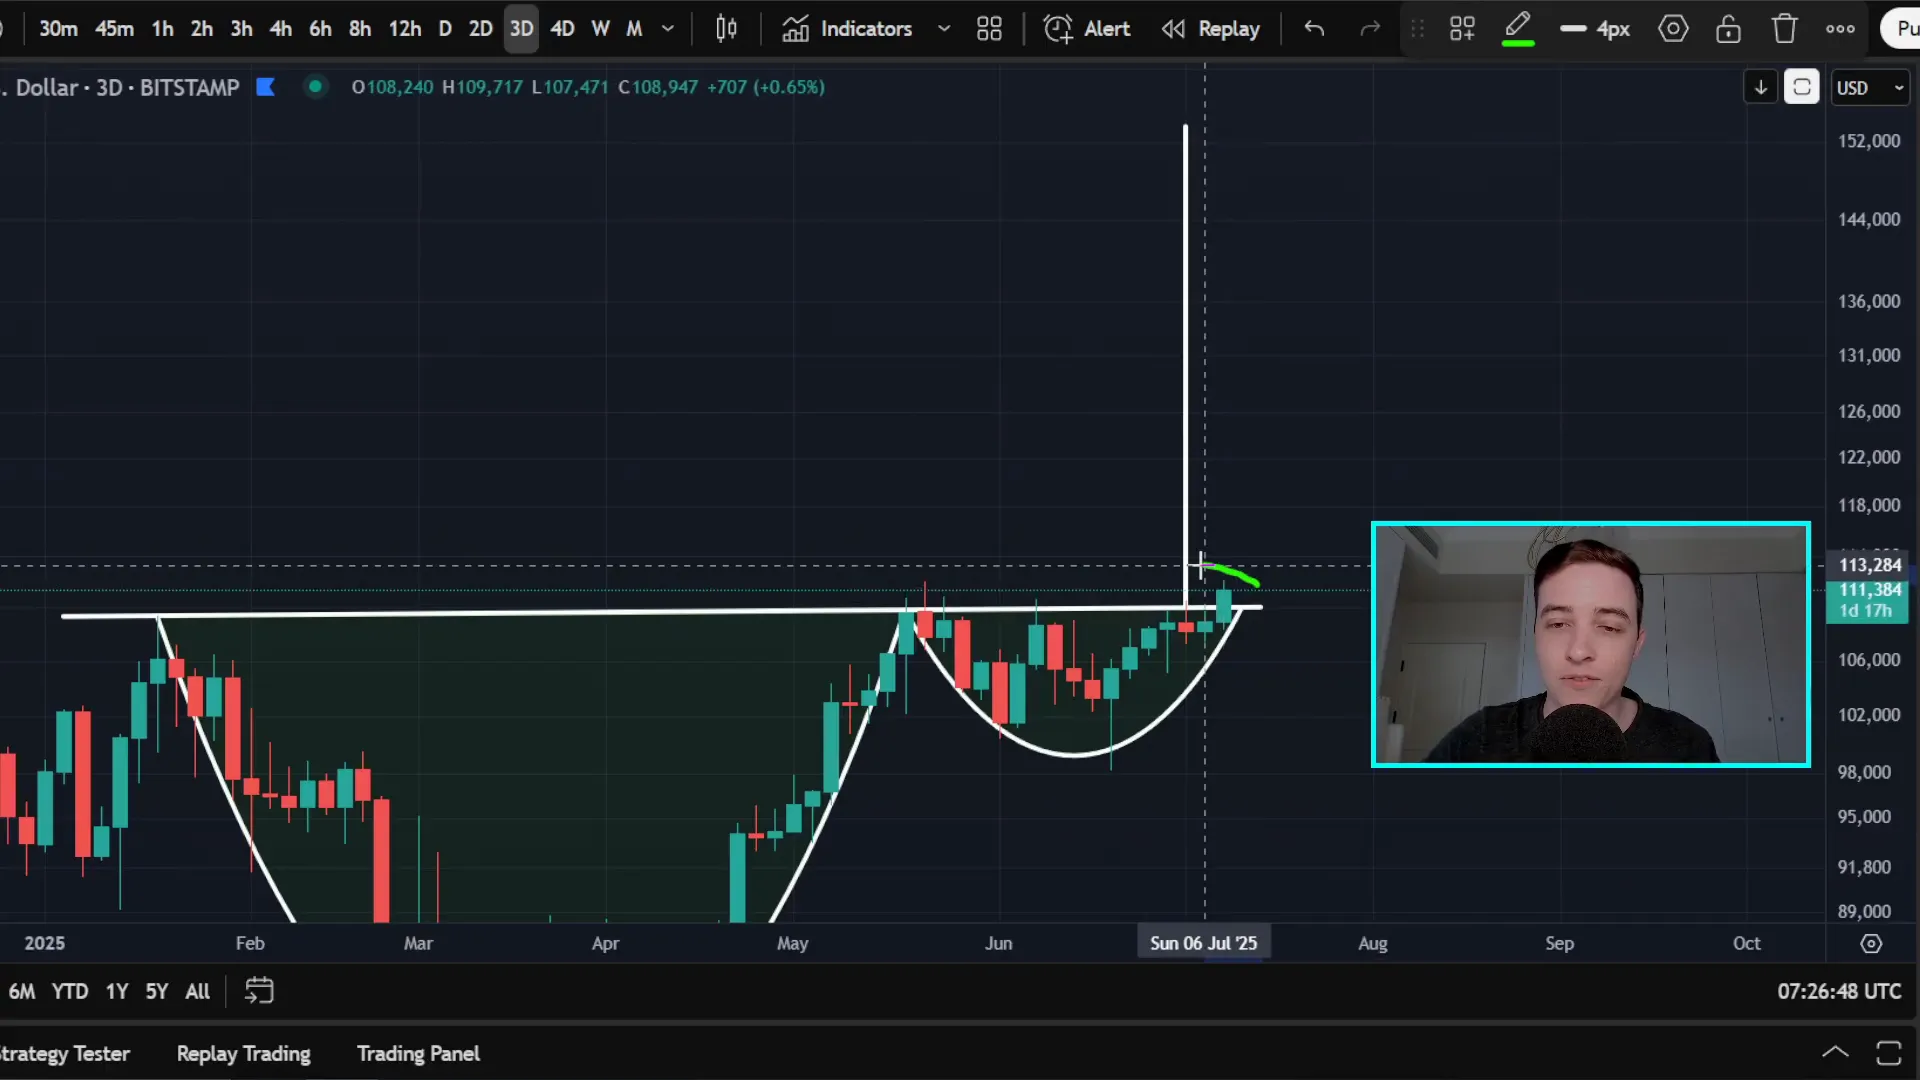
Shorter term, on the six-hour chart, Bitcoin has cleared resistance around $110,000 to $110,500 and is approaching the critical $112,000 resistance zone. Traders should watch for candle closes above this level to confirm that the bullish momentum is sustained.
Short-Term Trading Opportunities: Symmetrical Triangle Breakout and Price Target Hit
Just recently, Bitcoin hit a short-term bullish price target that was forecasted from a symmetrical (horizontal) triangle pattern. This breakout was activated when Bitcoin closed above the descending resistance line near $109,000 on the two-hour chart. The price target set from this pattern was approximately $111,500, which Bitcoin has now reached and is currently testing resistance around $111,500 to $112,000.
This pattern has played out as expected, signaling that the short-term bullish move is complete for now. Traders who entered long positions on the breakout could have captured quick profits by exiting near this price target.
Preparing for the Next Big Move
While this short-term pattern is complete, Bitcoin is now on the cusp of confirming a much larger breakout on the three-day chart, which could unlock the $153,000 price target. This makes now a critical moment to be ready to take advantage of upcoming trading opportunities.
If you’re planning to trade, it’s essential to have your accounts set up on reliable crypto exchanges that offer good liquidity and bonuses. Personally, I use BTNEXT, which offers no KYC requirements and significant trading bonuses—up to $45,000 in bonuses, including deposit bonuses. For example, depositing $1,000 can net you a $200 bonus. If you’re interested, check out the links provided below to claim these offers. Another great option is TwoBit, which also offers no KYC and massive bonuses.
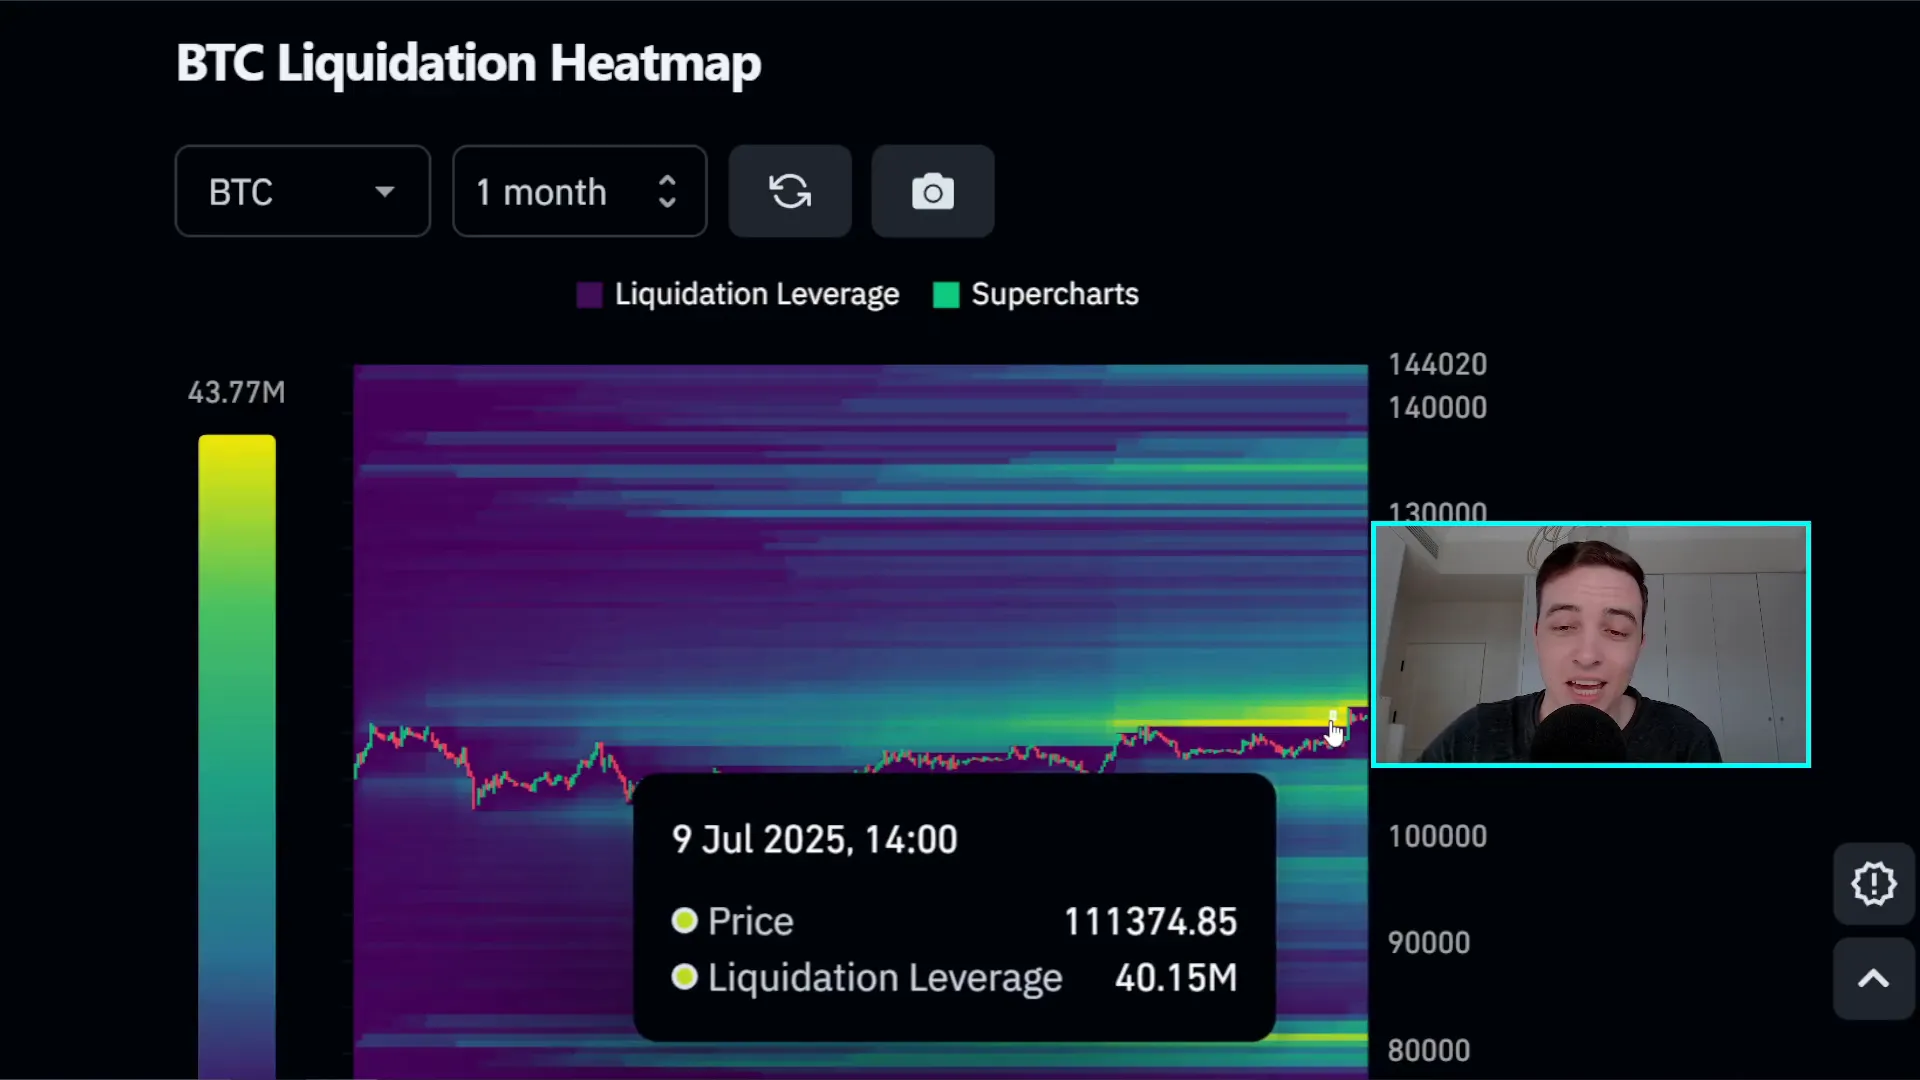
Bitcoin Liquidity and Market Structure Insights
Looking at the Bitcoin liquidation heat map, recent price action has cleared a significant cluster of liquidity between approximately $110,700 and $112,000. This liquidity zone had been building for weeks and tends to attract price action. Typically, Bitcoin gravitates toward areas where liquidity is concentrated, as traders’ stop losses and orders accumulate there.
Despite this liquidity being taken out, there remains some downside liquidity to be mindful of. However, with the new breakout, important support levels now exist between the current price and that downside liquidity, providing a buffer against sharp pullbacks.
Overall, the market structure and momentum indicators suggest Bitcoin remains more bullish than bearish, still firmly in a bull market. The next major liquidity cluster sits just above the previous all-time high, around $112,600, which will be an interesting battleground for bulls and bears.
Ethereum News and Price Outlook
Ethereum (ETH) has been riding the coattails of Bitcoin’s bullish breakout but also has its own strong fundamentals driving price action. Just yesterday, Ethereum saw a massive net inflow into spot Ethereum ETFs on Wall Street, totaling over $211 million in buying pressure. This kind of institutional interest is a powerful driver of bullish momentum.
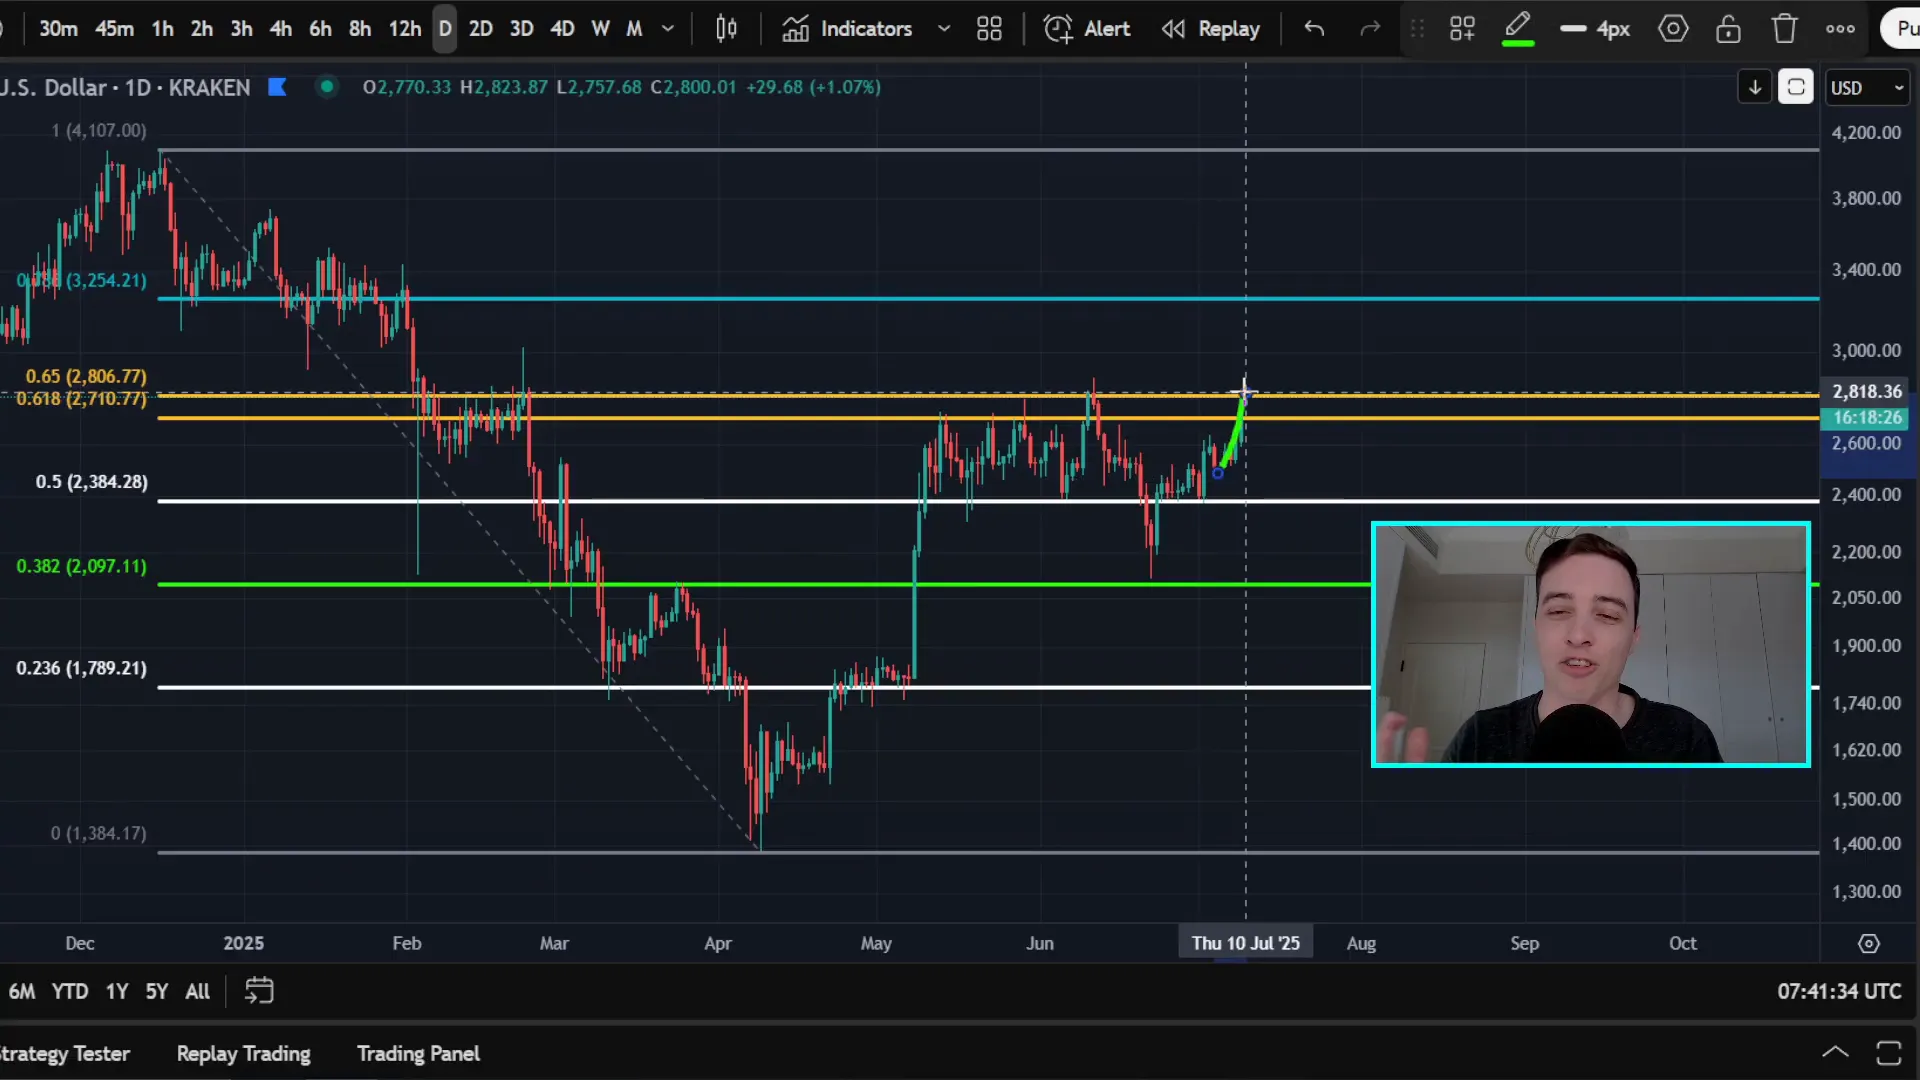
Currently, Ethereum is testing a critical resistance zone between $2,700 and $2,800. As of now, it’s hovering close to $2,800, and a confirmed breakout—ideally a daily candle close well above $2,850—would be a strong bullish signal. Holding this breakout as new support would further cement confidence in the upward move.
If Ethereum breaks above this resistance, the next price target to watch is the Fibonacci retracement zone near $3,200 to $3,300. This level could act as the next significant resistance where sellers might step in.
Ethereum vs. Bitcoin Performance
When analyzing Ethereum’s performance relative to Bitcoin, the ETH/BTC trading pair provides valuable insight. Over the past few days, Ethereum has been outperforming Bitcoin, showing strength against BTC. This outperformance suggests that Ethereum could see additional gains if this trend continues.
However, Ethereum is approaching strong resistance around 0.00255 to 0.0026 BTC per ETH. This zone could cause hesitation or rejection, so traders should monitor price action closely here.
Solana’s Bullish Setup: Cup and Handle Pattern Near Breakout
Solana (SOL) is also showing promising signs of bullish momentum, mirroring Bitcoin and Ethereum’s strength. It has been bouncing off a key support zone between $143 and $146 multiple times, reinforcing this level as a solid foundation for price recovery.
Recently, Solana began breaking out above short-term resistance around $155 to $156. This breakout opens the path toward the next resistance zone between $166 and $167, where the price may either stall or reject.
If Solana confirms a breakout with a daily candle close above $167, it could retrace all the way toward local highs near $185, set back in May. Conversely, rejection at this resistance could lead to a retest of the $146 to $150 support zone, potentially forming an inverse head and shoulders pattern—a classic bullish reversal pattern.
Short-Term Bullish Pattern: Cup and Handle
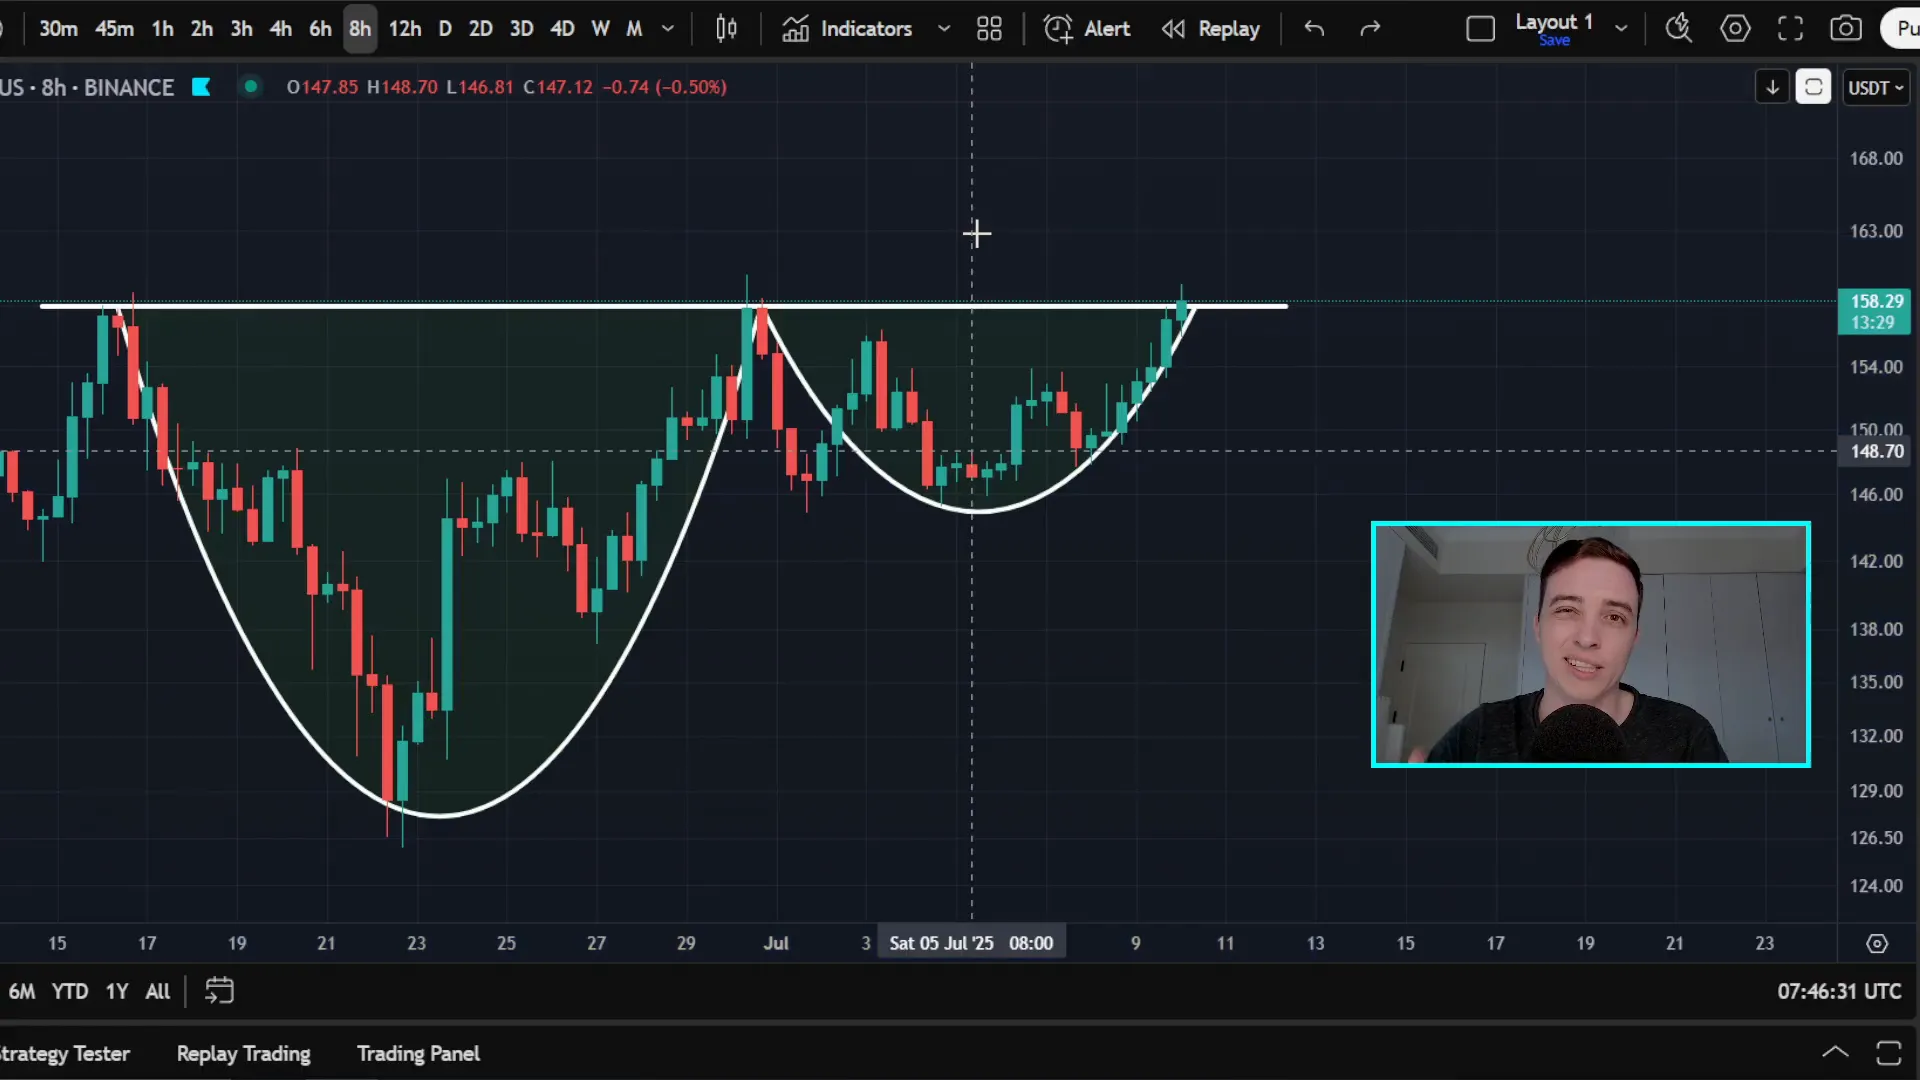
On the eight-hour chart, Solana has effectively completed the formation phase of a short-term cup and handle pattern, the same bullish pattern we discussed earlier with Bitcoin on the three-day chart. A confirmed breakout above the neckline near $158 to $159 would activate a bullish price target near $194.
This target represents a 22–23% move from the breakout point without leverage. Using 10x leverage could triple your money, but as always, leverage carries significant risk and requires careful risk management.
Traders should be mindful of resistance points along the way and consider scaling out of positions to lock in profits gradually. Stop losses should be placed just below the invalidation point of the breakout and trailed higher as the trade moves in profit.
XRP Breaks Out of Long-Term Resistance
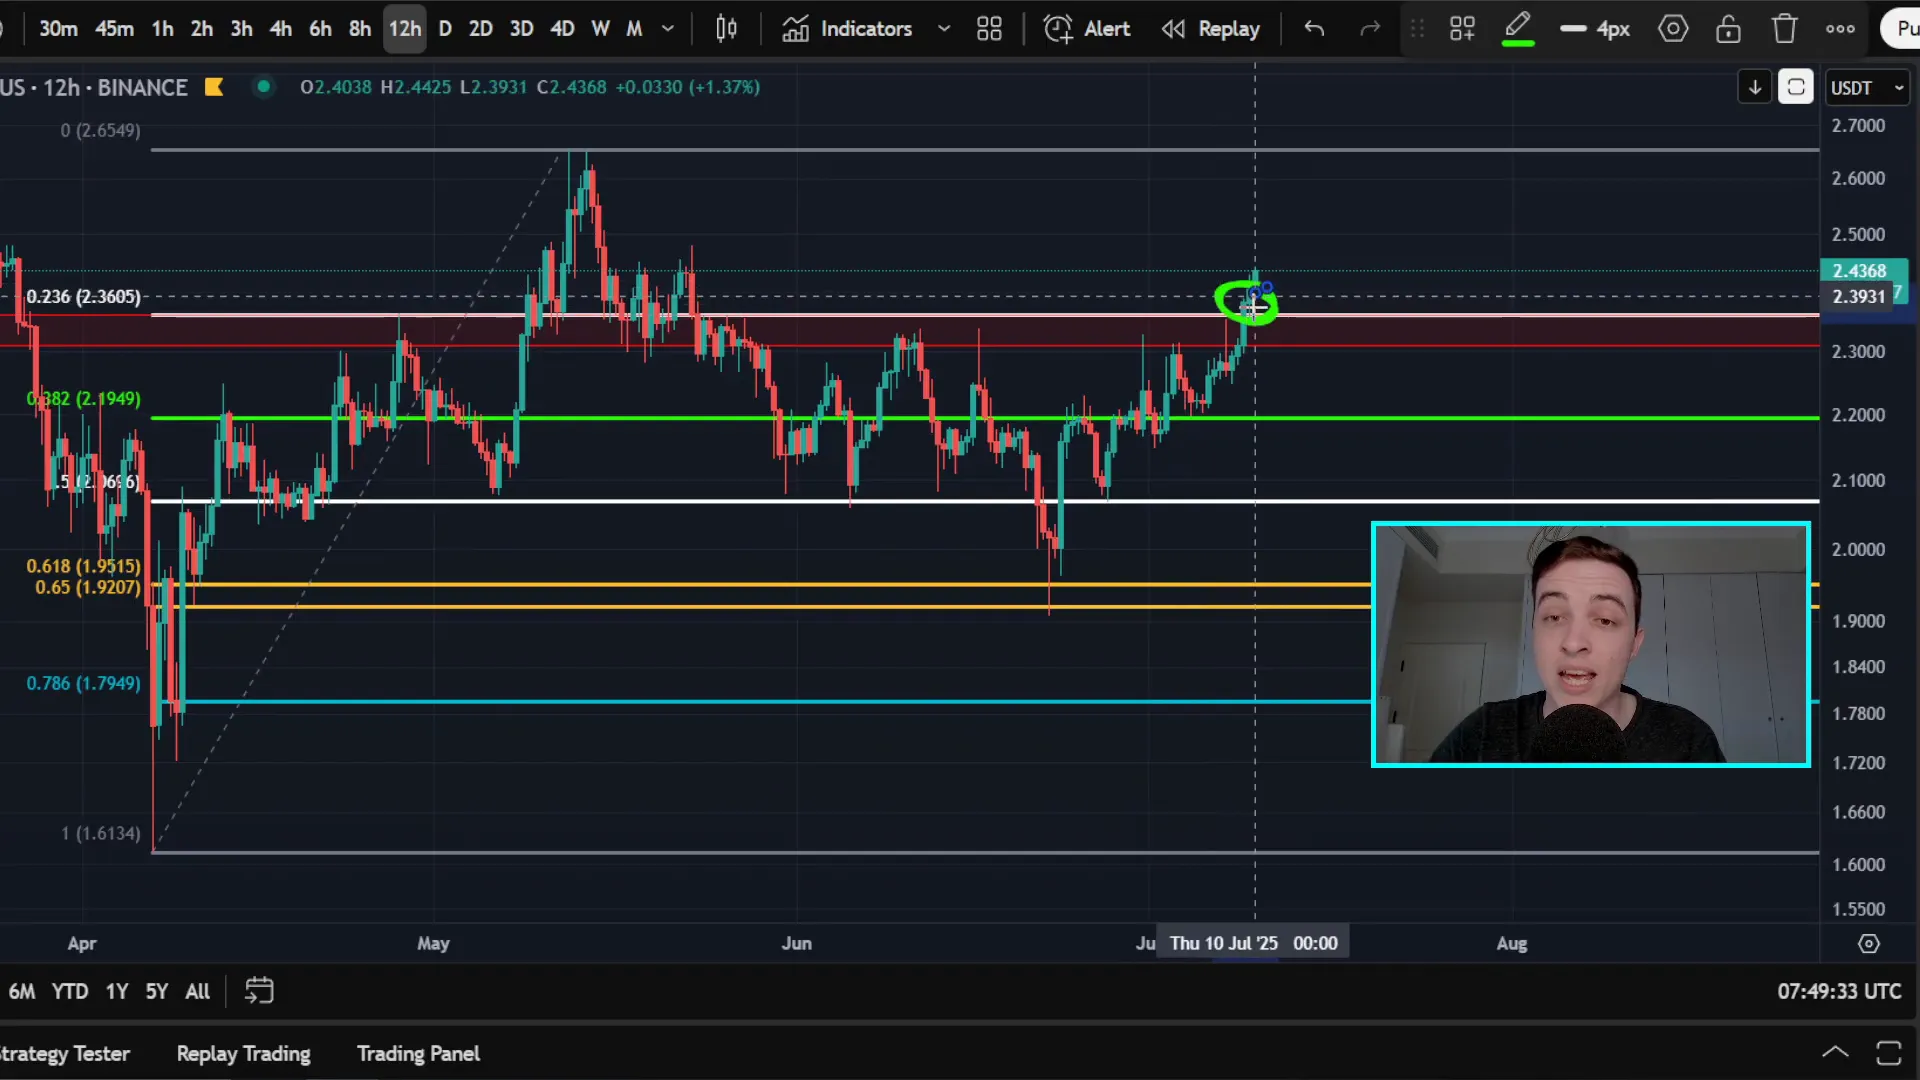
XRP has made a significant move, breaking out above a major resistance zone between $2.31 and $2.36 that had contained price for weeks or even months. Two consecutive 12-hour candle closes above $2.36 now signal a change in structure, with bullish momentum building.
Short-term resistance lies near $2.44, where XRP may encounter selling pressure. However, breaking above this level could propel XRP toward local highs around $2.60 to $2.65, the next significant resistance range.
If a pullback occurs, expect previous resistance between $2.31 and $2.36 to flip into support. This flip is a common technical phenomenon where old resistance becomes new support, offering a potential entry point for buyers.
Rising Wedge Pattern Invalidated to the Upside
Previously, XRP was trading within a rising wedge, a bearish reversal pattern. However, the breakout above the wedge resistance invalidates the bearish setup, shifting the focus toward bullish price targets. This breakout is a strong signal that the price structure is now bullish, with higher highs and higher lows forming.
Chainlink’s Bullish Momentum Builds Alongside Bitcoin
Chainlink (LINK) is following the broader market trend with a bullish bias. Like XRP, it has lacked strong momentum over the past couple of weeks but is now starting to build bullish momentum alongside Bitcoin and other top altcoins.
Currently, Chainlink faces resistance around $14.40 to $14.50. Confirming a 12-hour candle close above $14.50 and holding that level as support could lead to a move toward the next resistance zone between $15.30 and $15.50.
Breaking above $15.50, especially with a daily candle close, would be a significant bullish signal and could push Chainlink toward highs near $16.40 or even back to the $17.00 to $18.00 range.
Potential Inverse Head and Shoulders Pattern
If Chainlink faces rejection between $15.30 and $15.50, it may form an inverse head and shoulders pattern, a bullish reversal pattern that often signals a continuation of upward momentum once confirmed.
Support levels to watch include the $13.70 to $13.90 range, which has provided a strong foundation recently.
Positioning Yourself for the Next Moves in Bitcoin and Crypto
The recent breakout in Bitcoin and positive momentum in major altcoins like Ethereum, Solana, XRP, and Chainlink signal a potential bullish phase in the crypto market. However, these moves are not guaranteed to be smooth or linear. Expect resistance levels, pullbacks, and periods of sideways consolidation.
For traders, the key is to prepare in advance. Setting up accounts on reliable exchanges that offer good liquidity, trading bonuses, and low friction can make a big difference when opportunities arise. Exchanges like BTNEXT and TwoBit offer no KYC requirements and substantial bonuses for new users, making them attractive options for active traders.
Always apply sound risk management practices: use stop losses, avoid excessive leverage on larger timeframes, scale out of positions at resistance points, and move your stop loss to protect profits as trades move in your favor.
Final Thoughts on Navigating the Crypto Market Now
The crypto market is showing signs of life, with Bitcoin breaking out of significant patterns, Ethereum attracting institutional inflows, and key altcoins gearing up for bullish moves. These developments create exciting opportunities for investors and traders alike.
Remember, successful crypto investing and trading require a blend of technical analysis, market awareness, and disciplined risk management. Stay informed, watch key levels closely, and be ready to act when the market confirms your setups.
Keep an eye on Bitcoin’s three-day candle close above $110,000, Ethereum’s daily close above $2,850, and Solana’s breakout above $158 as critical signals for the next leg up. XRP and Chainlink continue to build bullish structures, and their performance will likely be influenced by Bitcoin’s trajectory.
By staying prepared and informed, you can position yourself to make the most of this bullish momentum in Bitcoin, Crypto, BTC, Blockchain, CryptoNews, and Investing.
Bitcoin Breakout Confirmed: What This Means for Crypto Investors in BTC, Ethereum, Solana, XRP & Chainlink. There are any Bitcoin Breakout Confirmed: What This Means for Crypto Investors in BTC, Ethereum, Solana, XRP & Chainlink in here.

