In the dynamic world of cryptocurrency and bitcoin, the next six months could prove to be a pivotal period for investors and traders alike. Market strategist Gareth Soloway shares his insights into the current state of bitcoin and the S&P 500, highlighting key resistance levels, potential market movements, and strategic considerations to prepare for what could be one of the most intense bull runs we've seen. Whether you're a short-term trader or a long-term investor, understanding these patterns and signals is essential to navigating this volatile landscape.
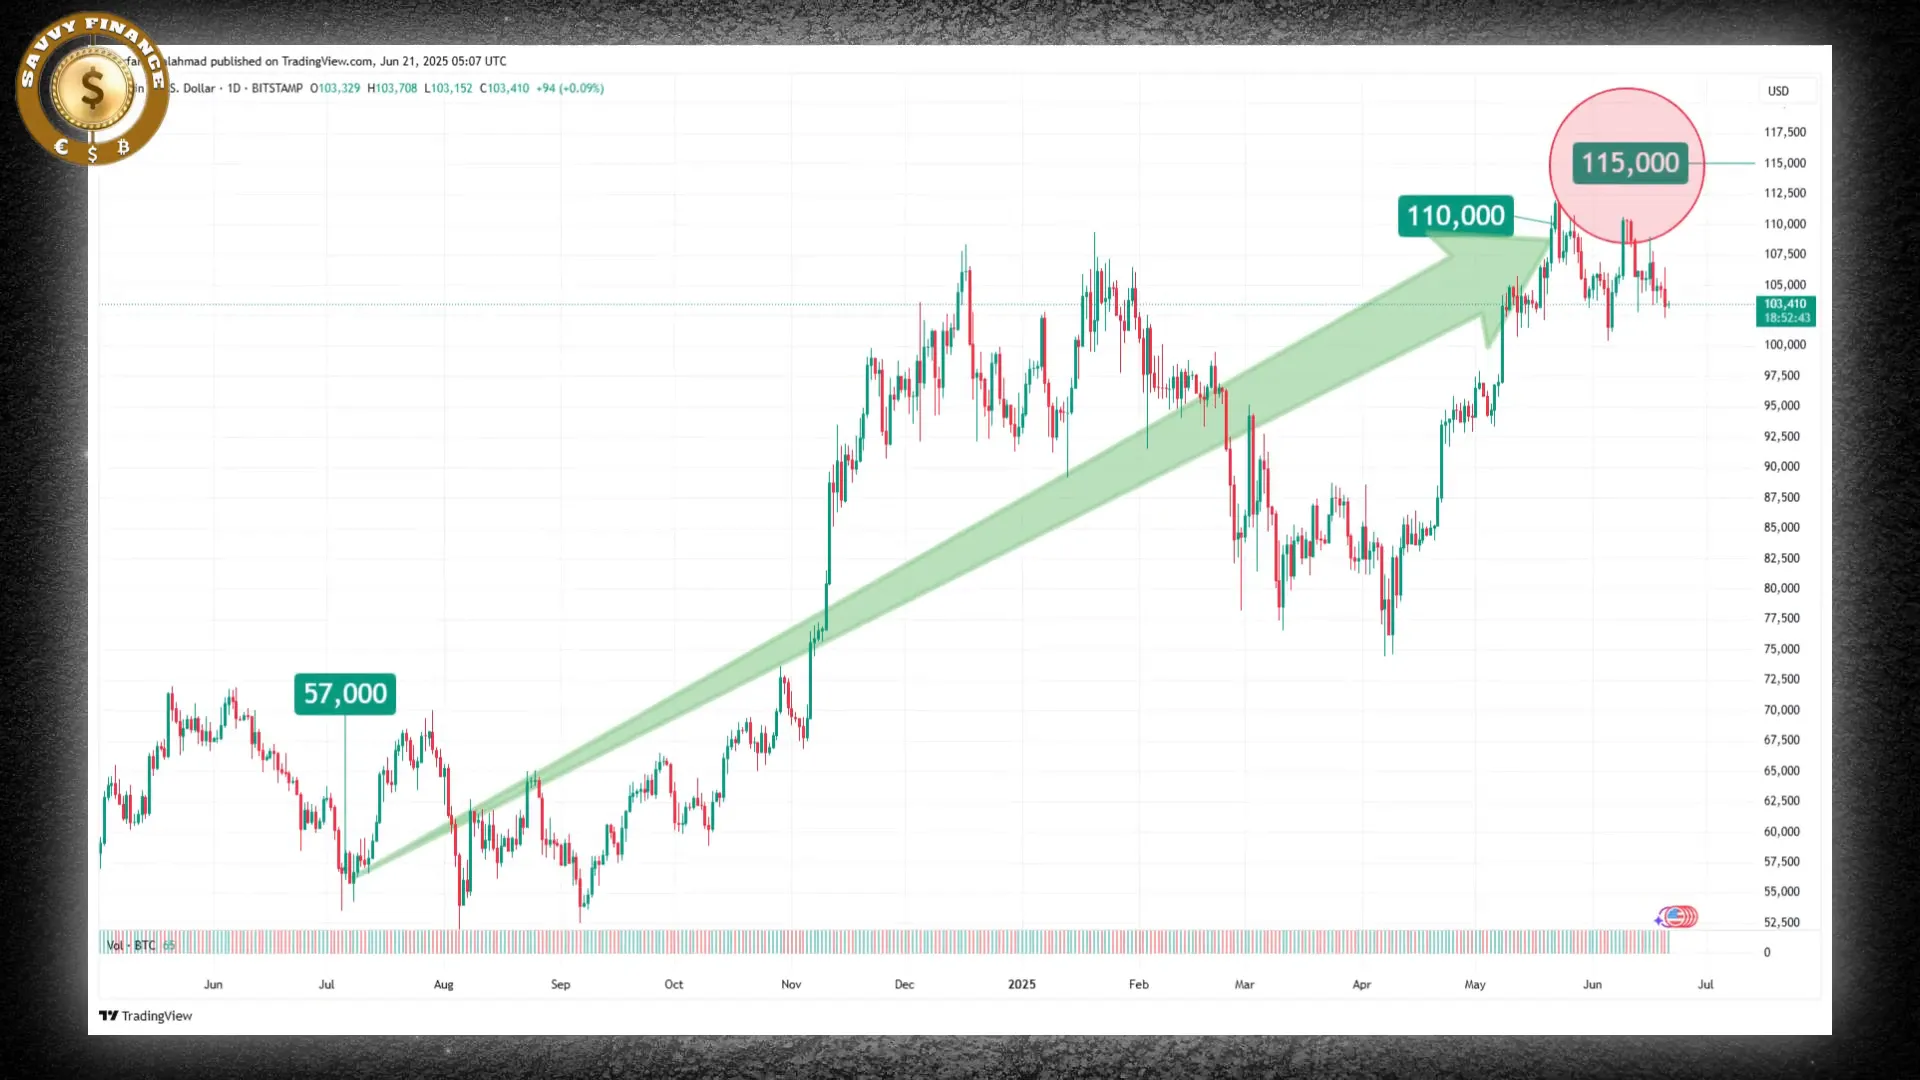
Table of Contents
- Bitcoin's Dramatic Rise and Volatility
- The S&P 500: Nearing Historic Resistance
- Nasdaq and Bitcoin: Parallel Trends and Correlations
- Investment Outlook: Beyond US Markets
- Final Thoughts: Prepare for Volatility and Opportunity
Bitcoin's Dramatic Rise and Volatility
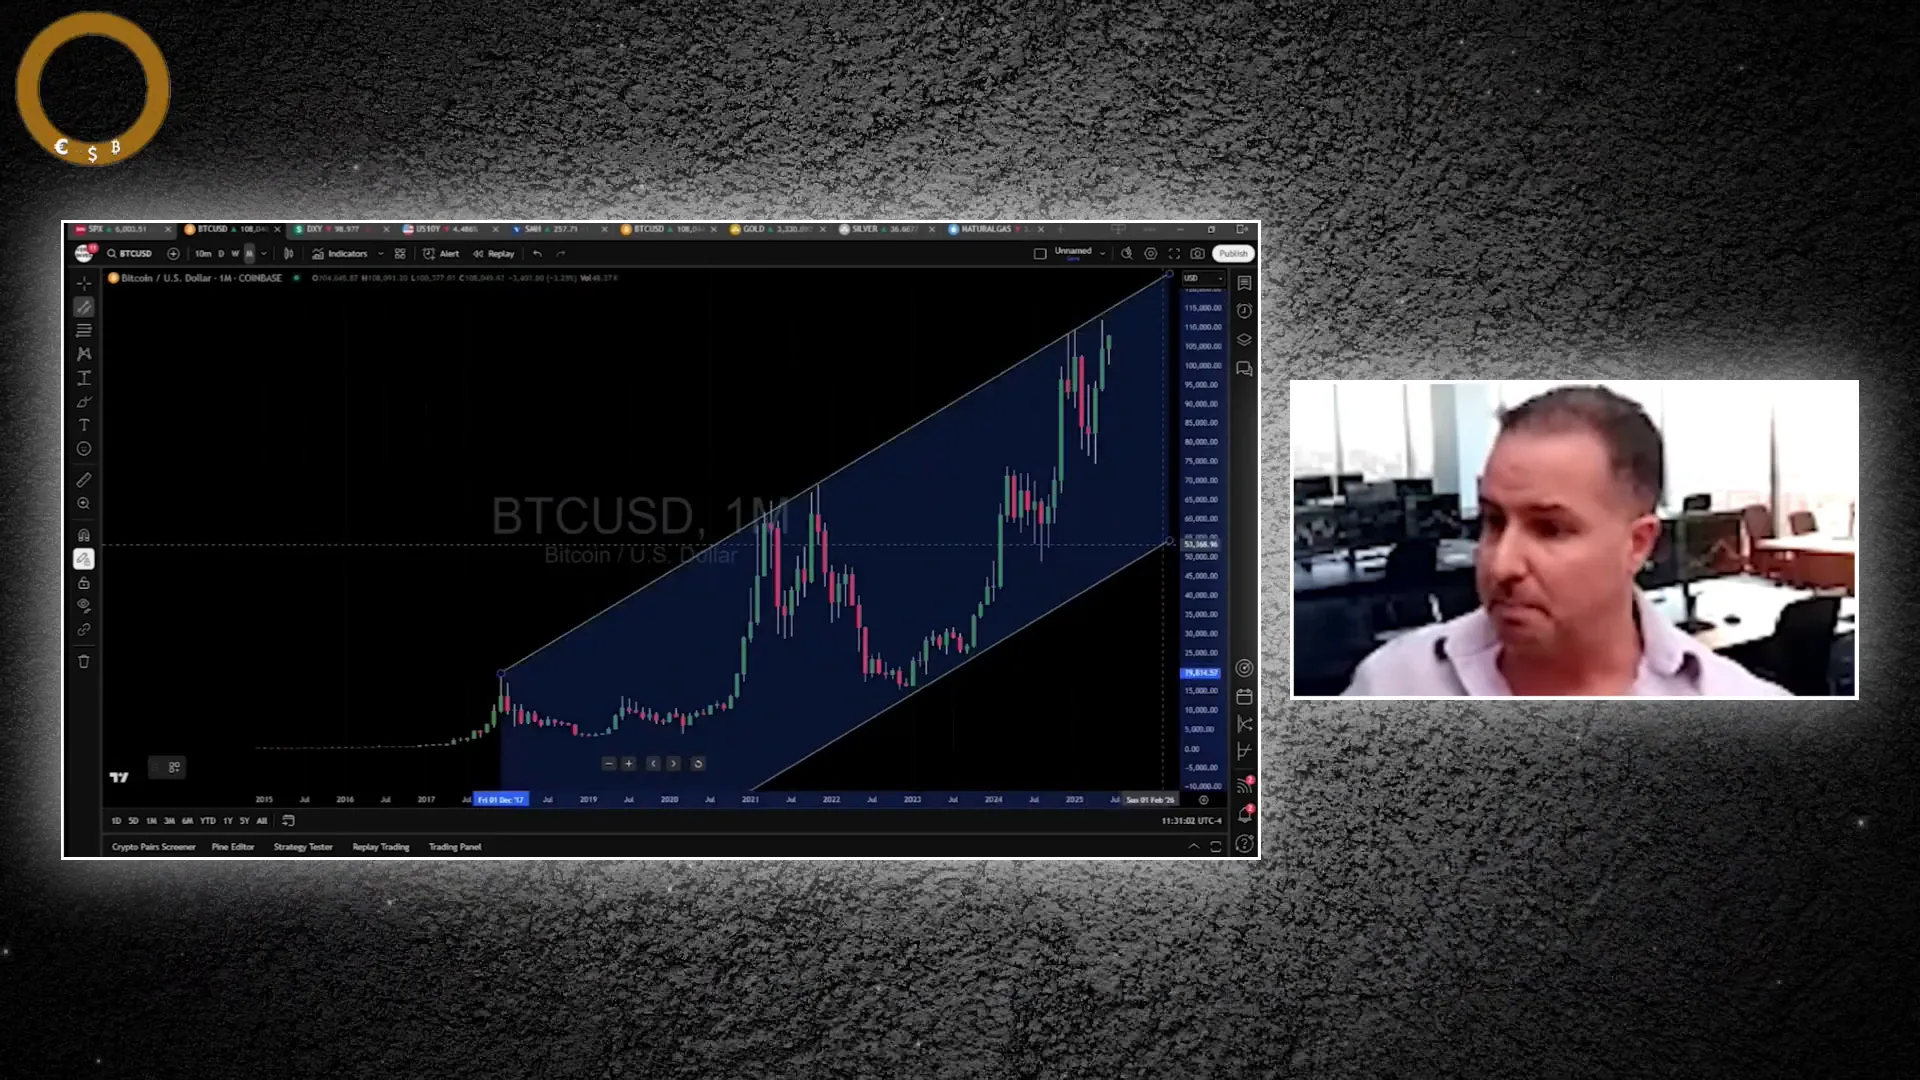
Over the past year, bitcoin has experienced a spectacular journey, climbing from a mid-2024 dip near $57,000 to an all-time high surpassing $110,000. This surge, however, has met stiff resistance around the $115,000 level, creating a critical technical stronghold that investors are watching closely.
Gareth explains that bitcoin's rally has often mirrored movements in the broader stock market, but with far greater intensity. The sharp rally has been driven by a blend of retail enthusiasm and renewed institutional interest, both groups quick to adjust their positions as economic conditions evolve.
This enthusiasm in equities tends to spill over into the crypto space but with more pronounced swings. Large players may attempt to push bitcoin prices above resistance levels temporarily, only to reverse and flush out latecomers—a classic market psychology pattern.
"Even in powerful bull cycles, Bitcoin is known for sudden, deep corrections. Pullbacks of 30 to 50 percent have been common throughout its history." — Gareth Soloway
A retreat to the $60,000 range would not signal failure but rather a healthy return to form, aligning with bitcoin's historical behavior during corrections.
The S&P 500: Nearing Historic Resistance
On the equity front, the S&P 500 is approaching critical levels, currently hovering around 6,000 points and nearing new all-time highs. This bullish sentiment is fueled by retail investors and hedge funds chasing the market, driven by repeated patterns of sharp recoveries following Federal Reserve interventions.
Gareth points out that retail investors have been conditioned to expect "V bottom" recoveries since the lows in March 2020, creating a self-fulfilling prophecy where markets bounce quickly after sell-offs. Hedge funds, often late to the rally, are now forced to chase gains into quarter-end to show positive results to their investors.
However, the S&P 500 is approaching a historically significant logarithmic trend line that has marked major market peaks since 1929. This line also connects to the highs of the dot-com bubble era. Every time this resistance has been tested, the market has experienced a major pullback, including the recent nearly 20% drop.
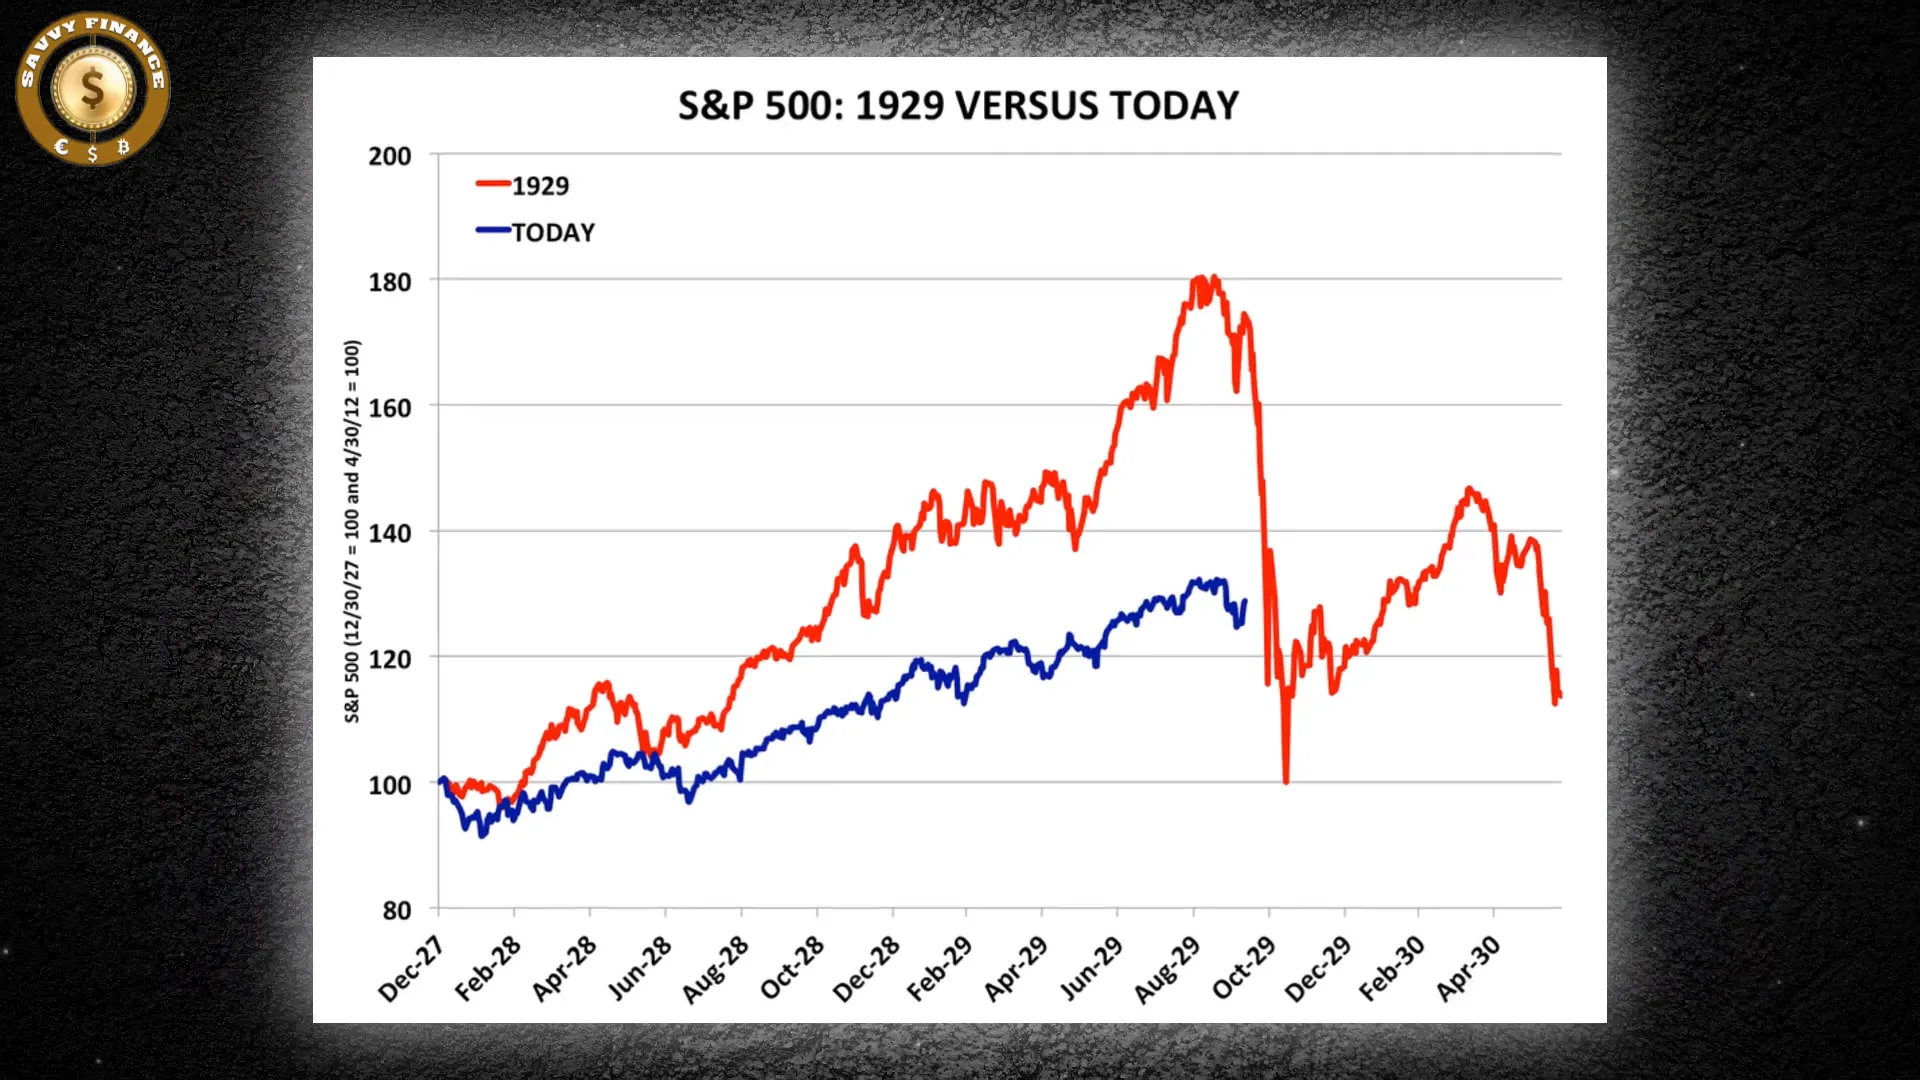
Gareth warns that if the index pushes up to approximately 6,225 to 6,250 points, it could trigger a significant drawdown. Despite optimistic headline labor numbers, the underlying global and domestic economy is slowing, and current stock valuations remain historically expensive.
When Might the S&P 500 Reverse?
While no one can predict exact tops or bottoms, the market is about 2.3% from all-time highs. Breaking above this level could induce a panic stop-out among short sellers and pull in skeptical investors, potentially forming a double top before a reversal.
Sector-specific charts, particularly in semiconductors, are already showing resistance signs. The SMH semiconductor ETF recently hit a major resistance zone and began pulling back, signaling waning market momentum.
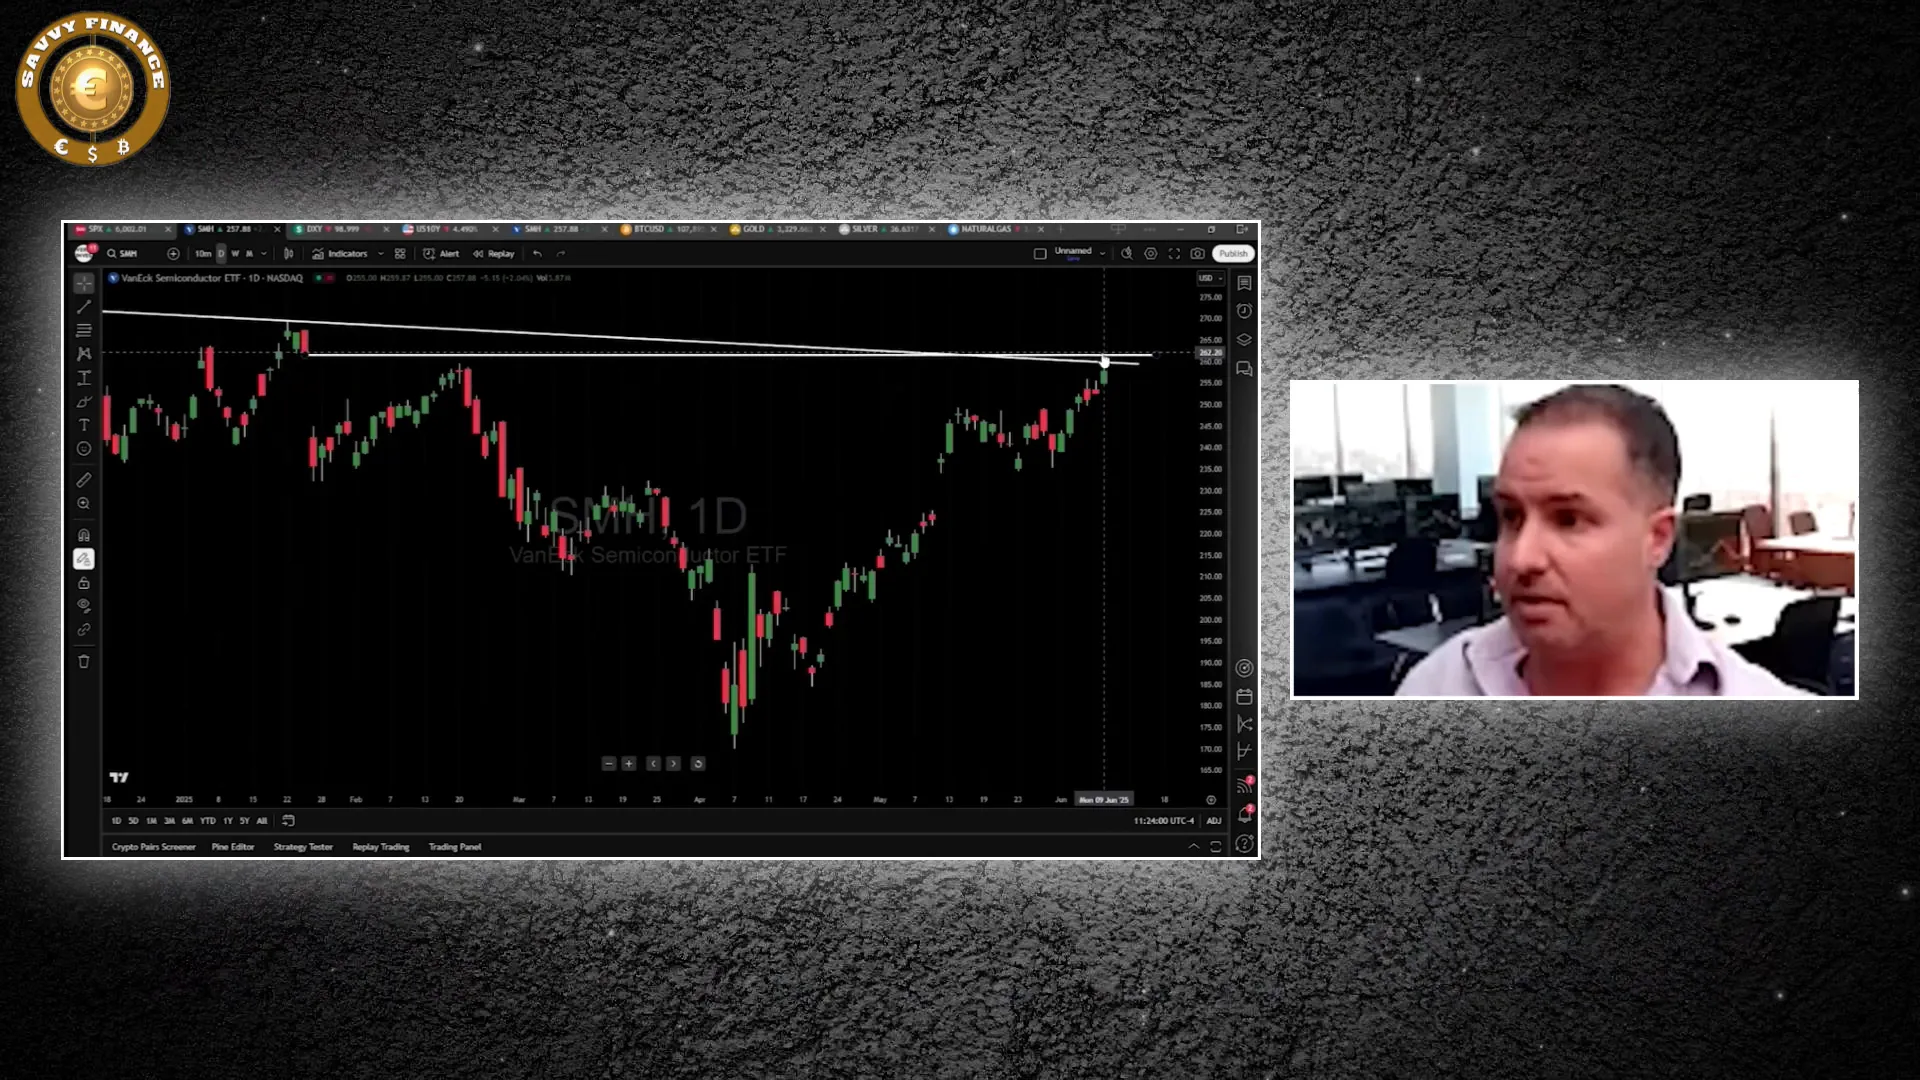
Gareth stresses that the market is running out of energy, and once economic data points weaken—as they inevitably will—the market could face corrections ranging from 10% to 30% or more.
Nasdaq and Bitcoin: Parallel Trends and Correlations
The Nasdaq index shares a similar technical outlook with bitcoin. Both assets have shown a strong correlation, often moving in unison, although bitcoin occasionally diverges during unique events like shifts in Treasury demand or dollar strength.
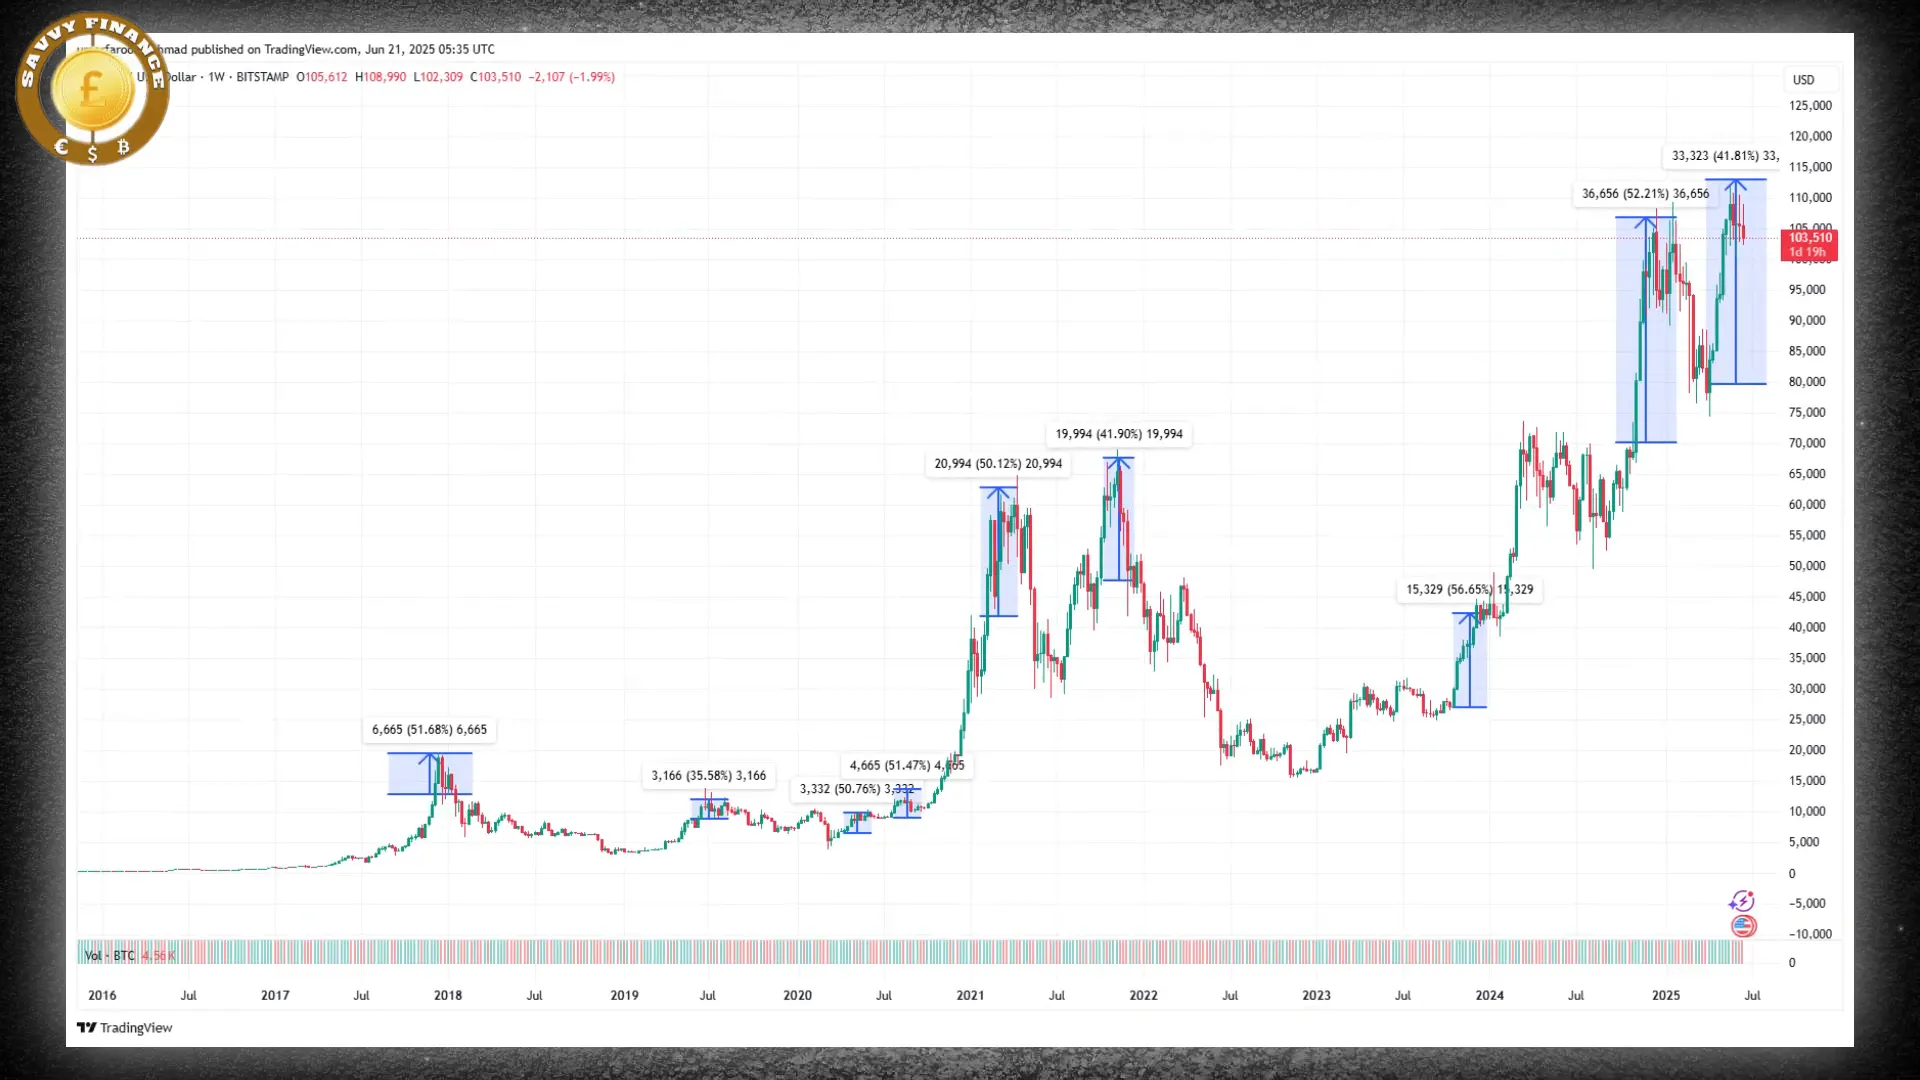
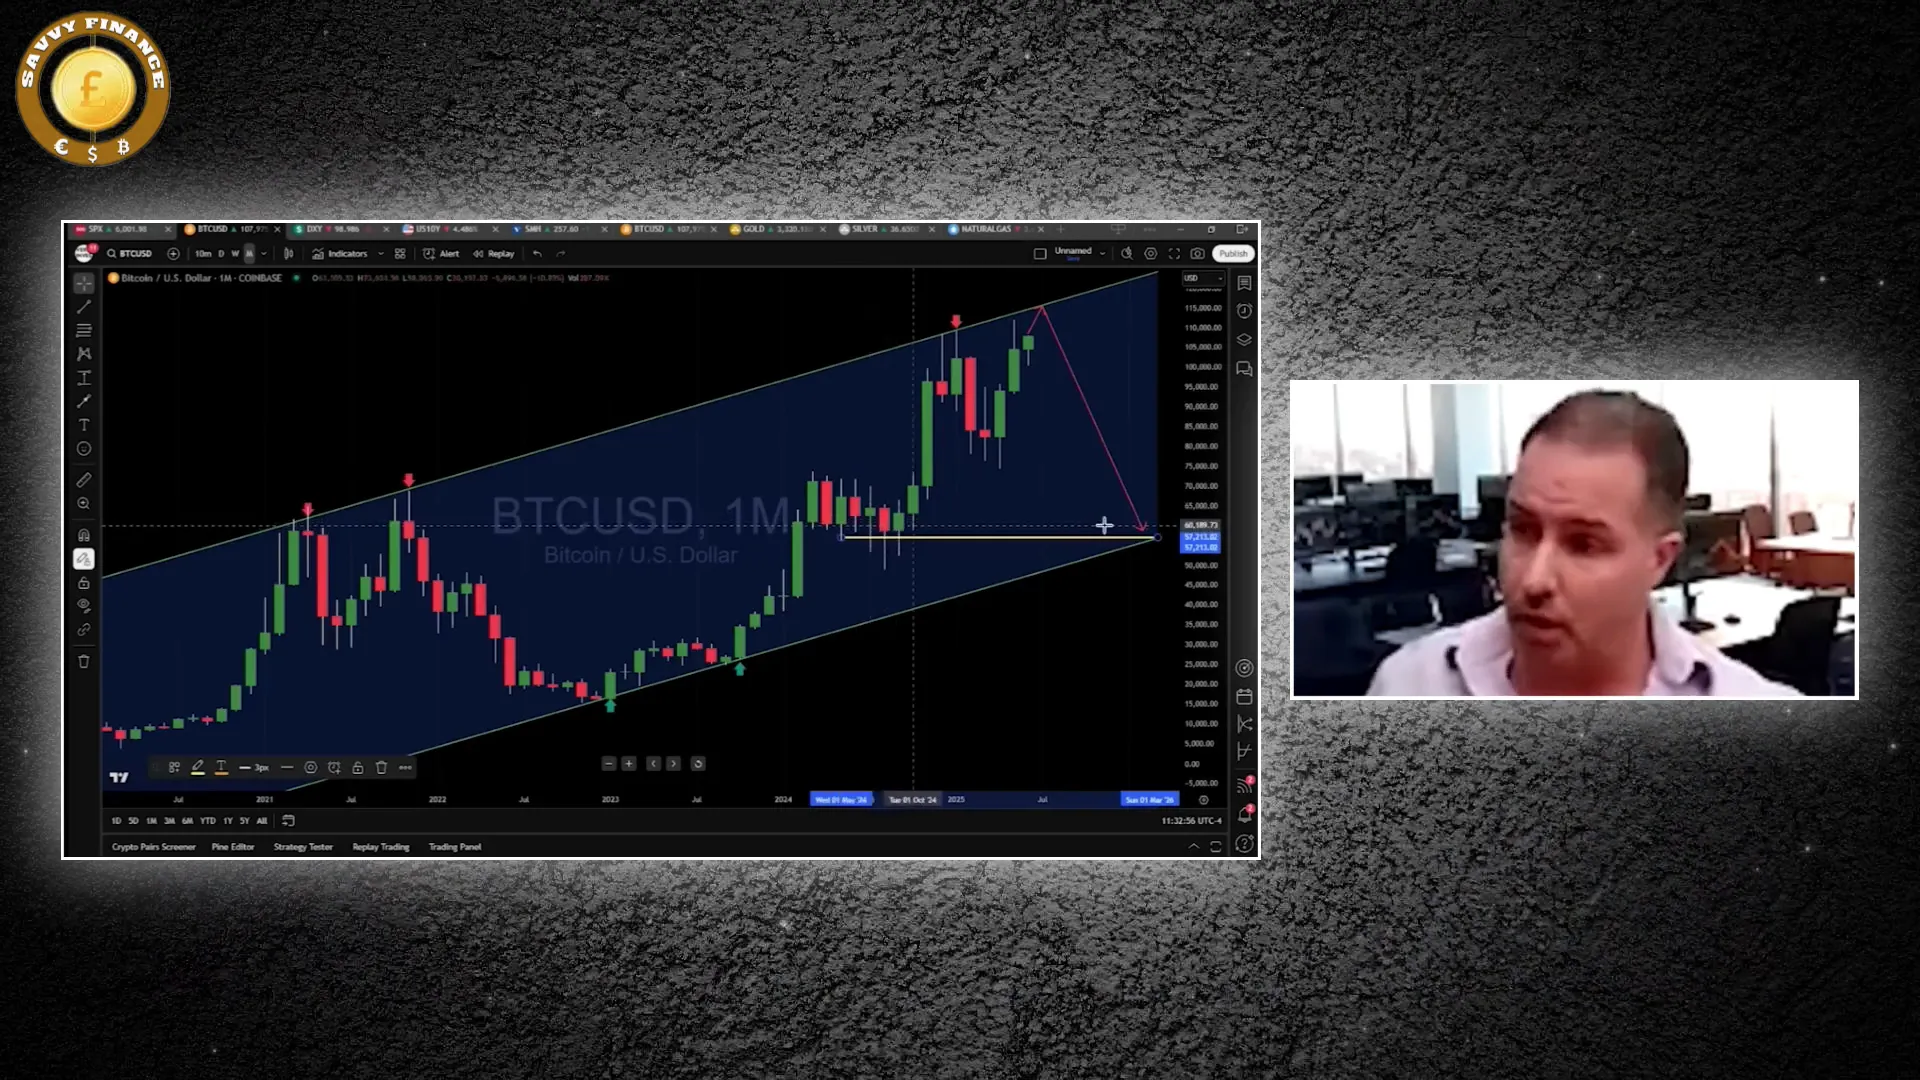
Gareth highlights a parallel trend line on bitcoin's chart that has acted as resistance at key highs in 2017, 2021, 2024, and early 2025. This suggests that while bitcoin may push higher in the short term, it faces substantial resistance near the $113,000 to $115,000 range.
Should bitcoin breach this ceiling, Gareth advises caution, noting that institutions may push prices slightly higher to shake out weak short sellers before reversing sharply. If confirmed, a move above $115,000 could target the $150,000 zone next, but until then, this level remains a key resistance.
What About Corrections?
Bitcoin's history of 30-50% pullbacks means a retreat to around $55,000 to $60,000 would be a healthy correction rather than a failure. This range coincides with strong support from a year ago, making it a potential buying opportunity for long-term investors.
Gareth differentiates between short-term and long-term strategies: short-term traders should be cautious or consider shorting bitcoin near resistance with stops above $115,000. Meanwhile, long-term investors can benefit from dollar-cost averaging during dips, as bitcoin's overall trend remains upward.
Investment Outlook: Beyond US Markets
Looking ahead to the remainder of the year, Gareth expresses a preference for international stocks over US equities. Markets like Brazil and China show promising chart patterns after long downtrends, with expected breakouts that could attract capital rotating out of US markets.
For example, Brazil's ETF displays a wedge pattern hinting at an imminent breakout, while Chinese stocks like Baidu and Alibaba are positioned near significant technical levels that could lead to gains.
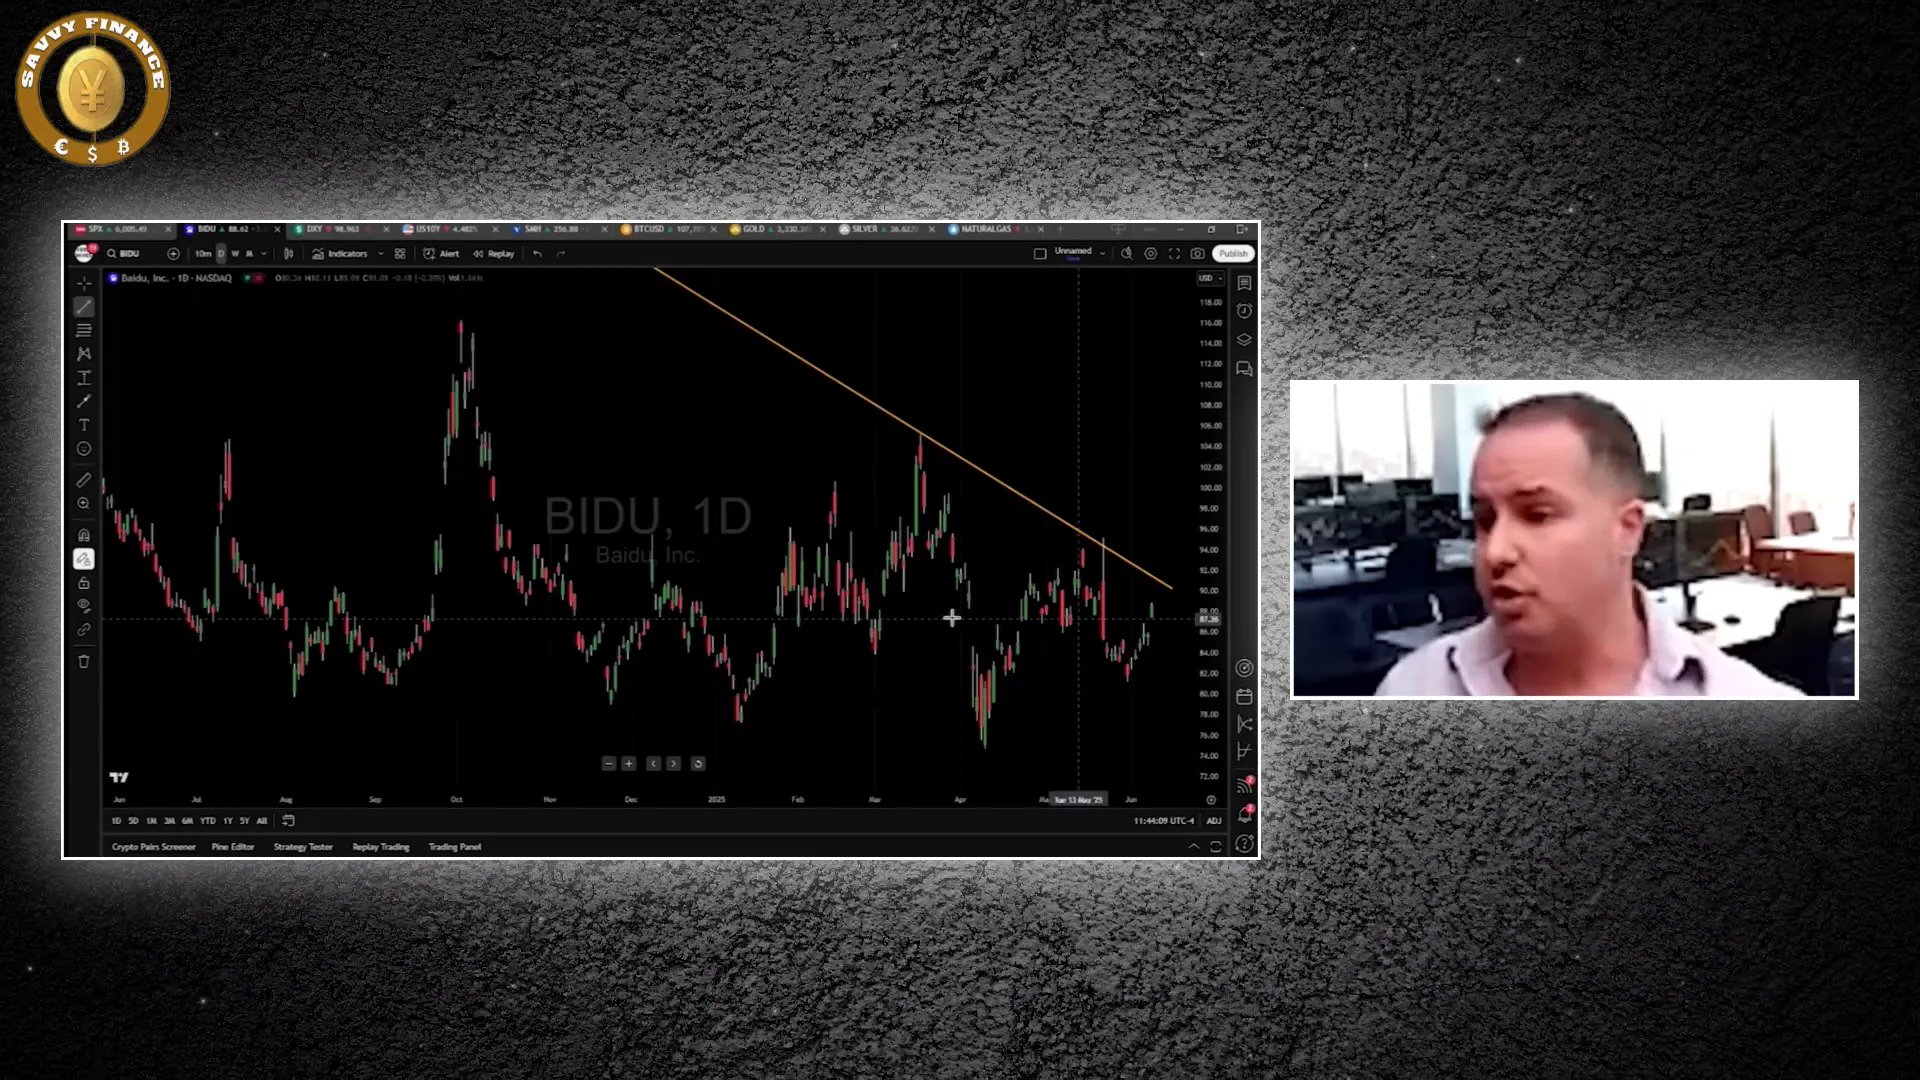
While China carries risks, political developments such as efforts to ease trade tensions could support market advances. Investors should watch these unloved external markets closely for opportunities.
Final Thoughts: Prepare for Volatility and Opportunity
The interplay between cryptocurrency, bitcoin, and traditional equity markets offers a fascinating glimpse into investor psychology and market dynamics. With bitcoin and the S&P 500 at pivotal resistance levels, the next six months promise significant volatility—potentially the craziest bull run or a sharp correction.
Key takeaways for investors include:
- Respect critical resistance levels: $115,000 for bitcoin and 6,225-6,250 for the S&P 500.
- Expect potential sharp pullbacks of 10-30% as markets test these ceilings.
- Short-term traders should remain cautious, using stops and considering short positions near resistance.
- Long-term investors can use dollar-cost averaging during corrections to build positions.
- Explore international markets like Brazil and China for diversification and growth potential.
Are you ready to navigate the next phase of the cryptocurrency and bitcoin markets? Watch for confirmations of resistance breaches, stay alert to economic data shifts, and balance optimism with prudence as you prepare for what could be a historic period in investing.
What’s your take on bitcoin’s potential to break above $115,000? Is a major correction looming? Share your thoughts and join the conversation.
The Next 6 Months Will Be CRUCIAL! Prepare for the Craziest Bull Run in Cryptocurrency and Bitcoin. There are any The Next 6 Months Will Be CRUCIAL! Prepare for the Craziest Bull Run in Cryptocurrency and Bitcoin in here.

