
Bitcoin is trading near its all-time highs, but unlike the frenzied peaks of 2017 and 2021, the market today is showing a remarkably disciplined and healthy rally. There’s no meme-fueled mania, no overcrowded leverage, and no overwhelming retail euphoria. Instead, what we’re witnessing is a structurally different crypto cycle, one driven by institutional capital, macroeconomic alignment, and technological integration.
In this article, we explore the insights shared by macro analysts Raoul Pal and Jamie Coutts, who reveal why the current environment could signal a longer, more sustained crypto cycle. They unpack how global liquidity, sovereign wealth funds, and leverage positioning come together to create a powerful setup for Bitcoin and the broader cryptocurrency market.
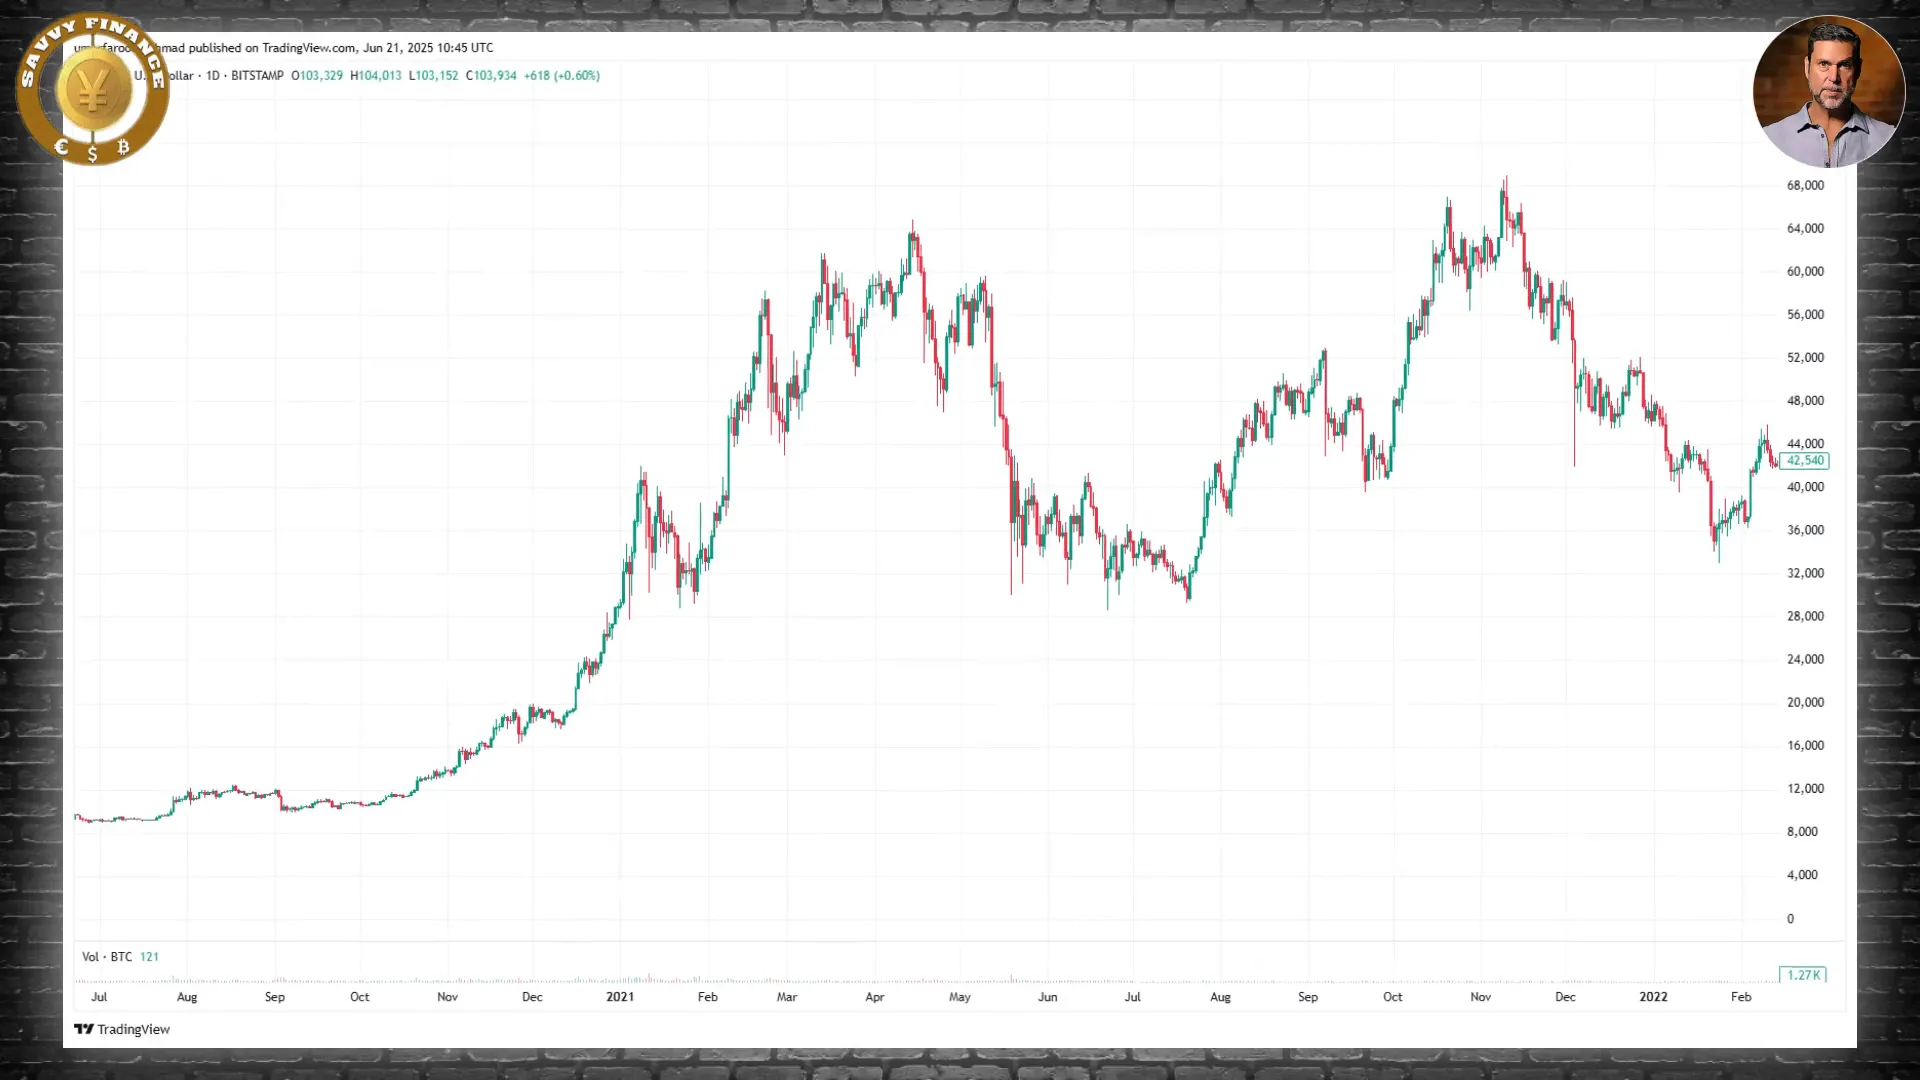
Table of Contents
- The Calm Beneath the Surface: What Sets This Cycle Apart
- Global Liquidity: The Driving Force Behind Bitcoin’s Price Moves
- Why Breaking Out of Liquidity Contraction Matters
- Low Leverage and Balanced Positioning: Signs of a Healthy Market
- Introducing the Global Liquidity Risk Score: A Real-Time Dashboard for Cycle Timing
- Why We’re Early in the Cycle, Not Late
- What This Means for Cryptocurrency Investors
- Conclusion: A New Era for Bitcoin and Cryptocurrency
The Calm Beneath the Surface: What Sets This Cycle Apart
Unlike previous Bitcoin bull runs that burned hot and fast, this cycle is unfolding under vastly different conditions. Raoul Pal’s firsthand experience meeting with sovereign wealth funds across the Middle East highlights a key trend: these large institutional investors are not only adopting Bitcoin as a reserve asset but are also building entire government infrastructures on blockchain technology. From driving licenses to property deeds, blockchain is becoming foundational at a national level.
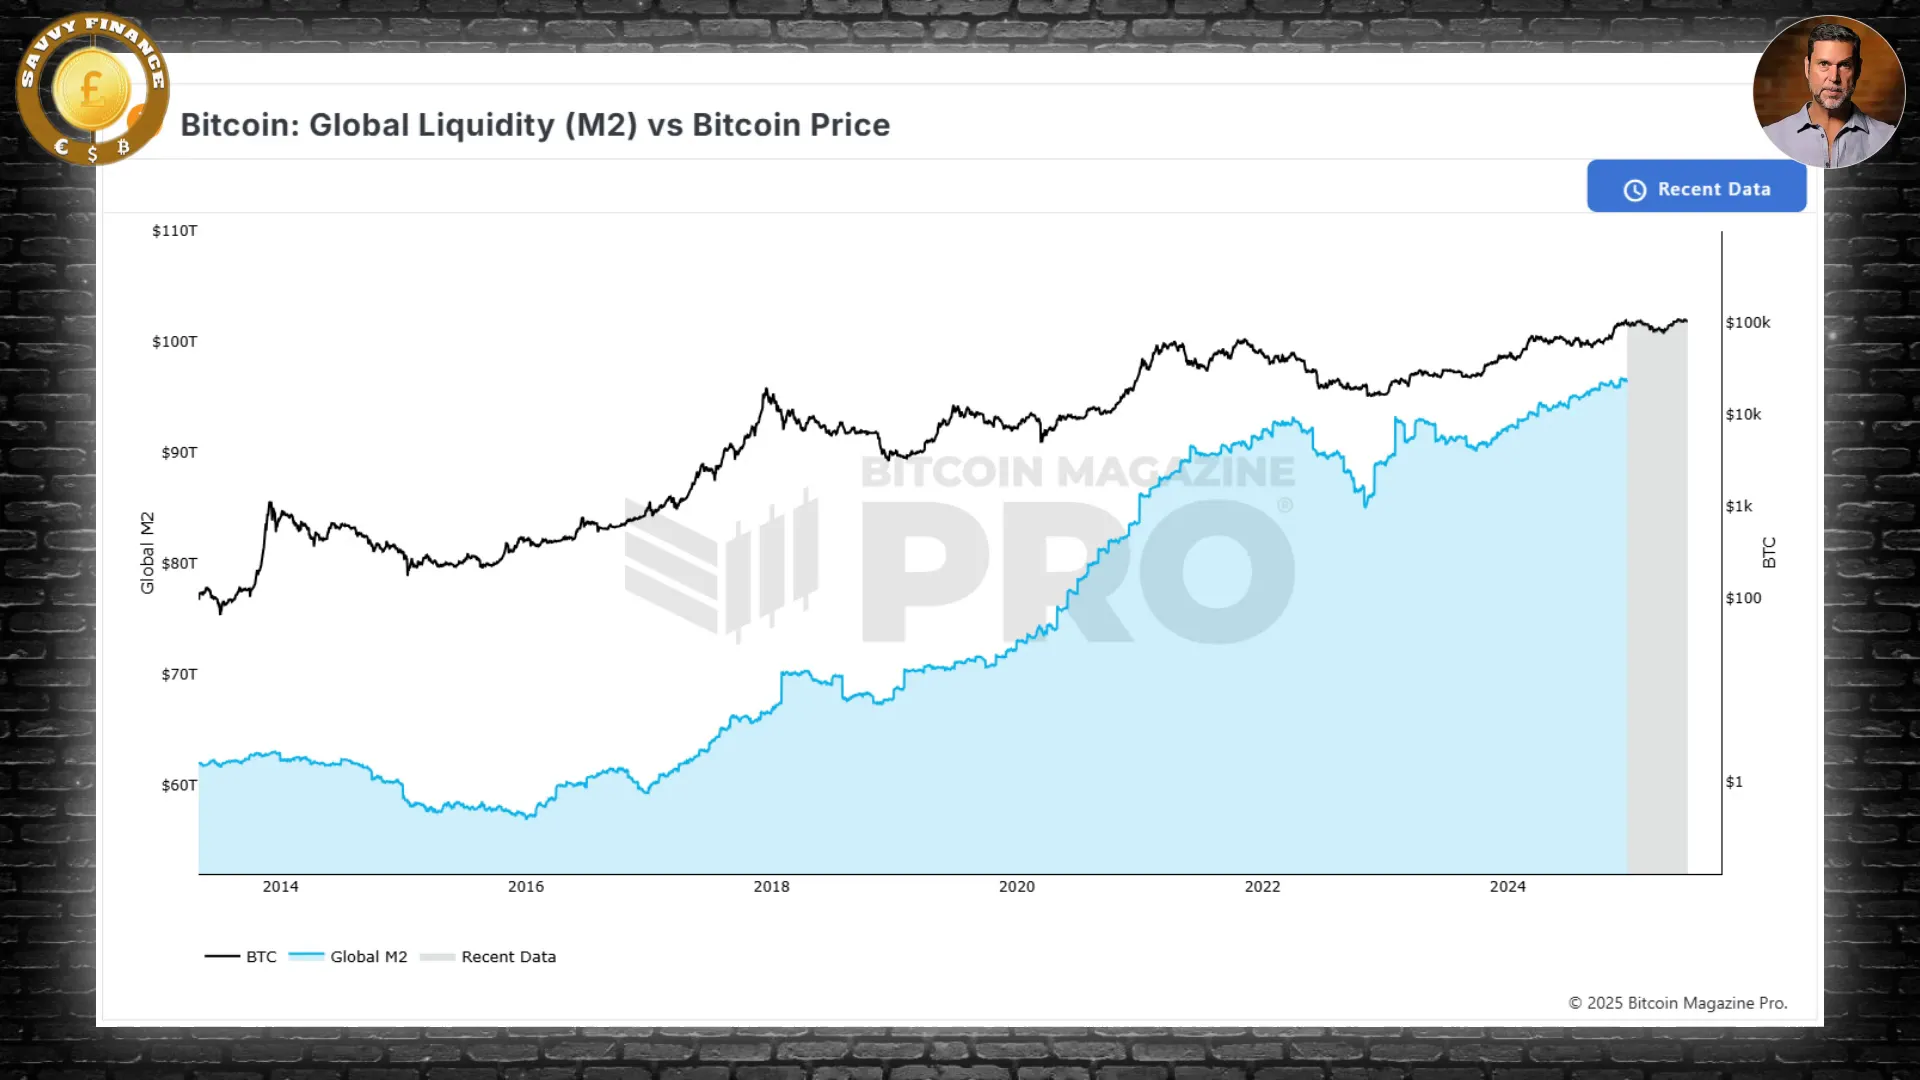
This shift towards institutional adoption and infrastructure integration is complemented by a broader macroeconomic development — a breakout in global liquidity after a multi-year contraction. Global liquidity, which aggregates private credit, central bank balance sheets, FX reserves, and money supply, is a crucial driver of asset prices, including Bitcoin.
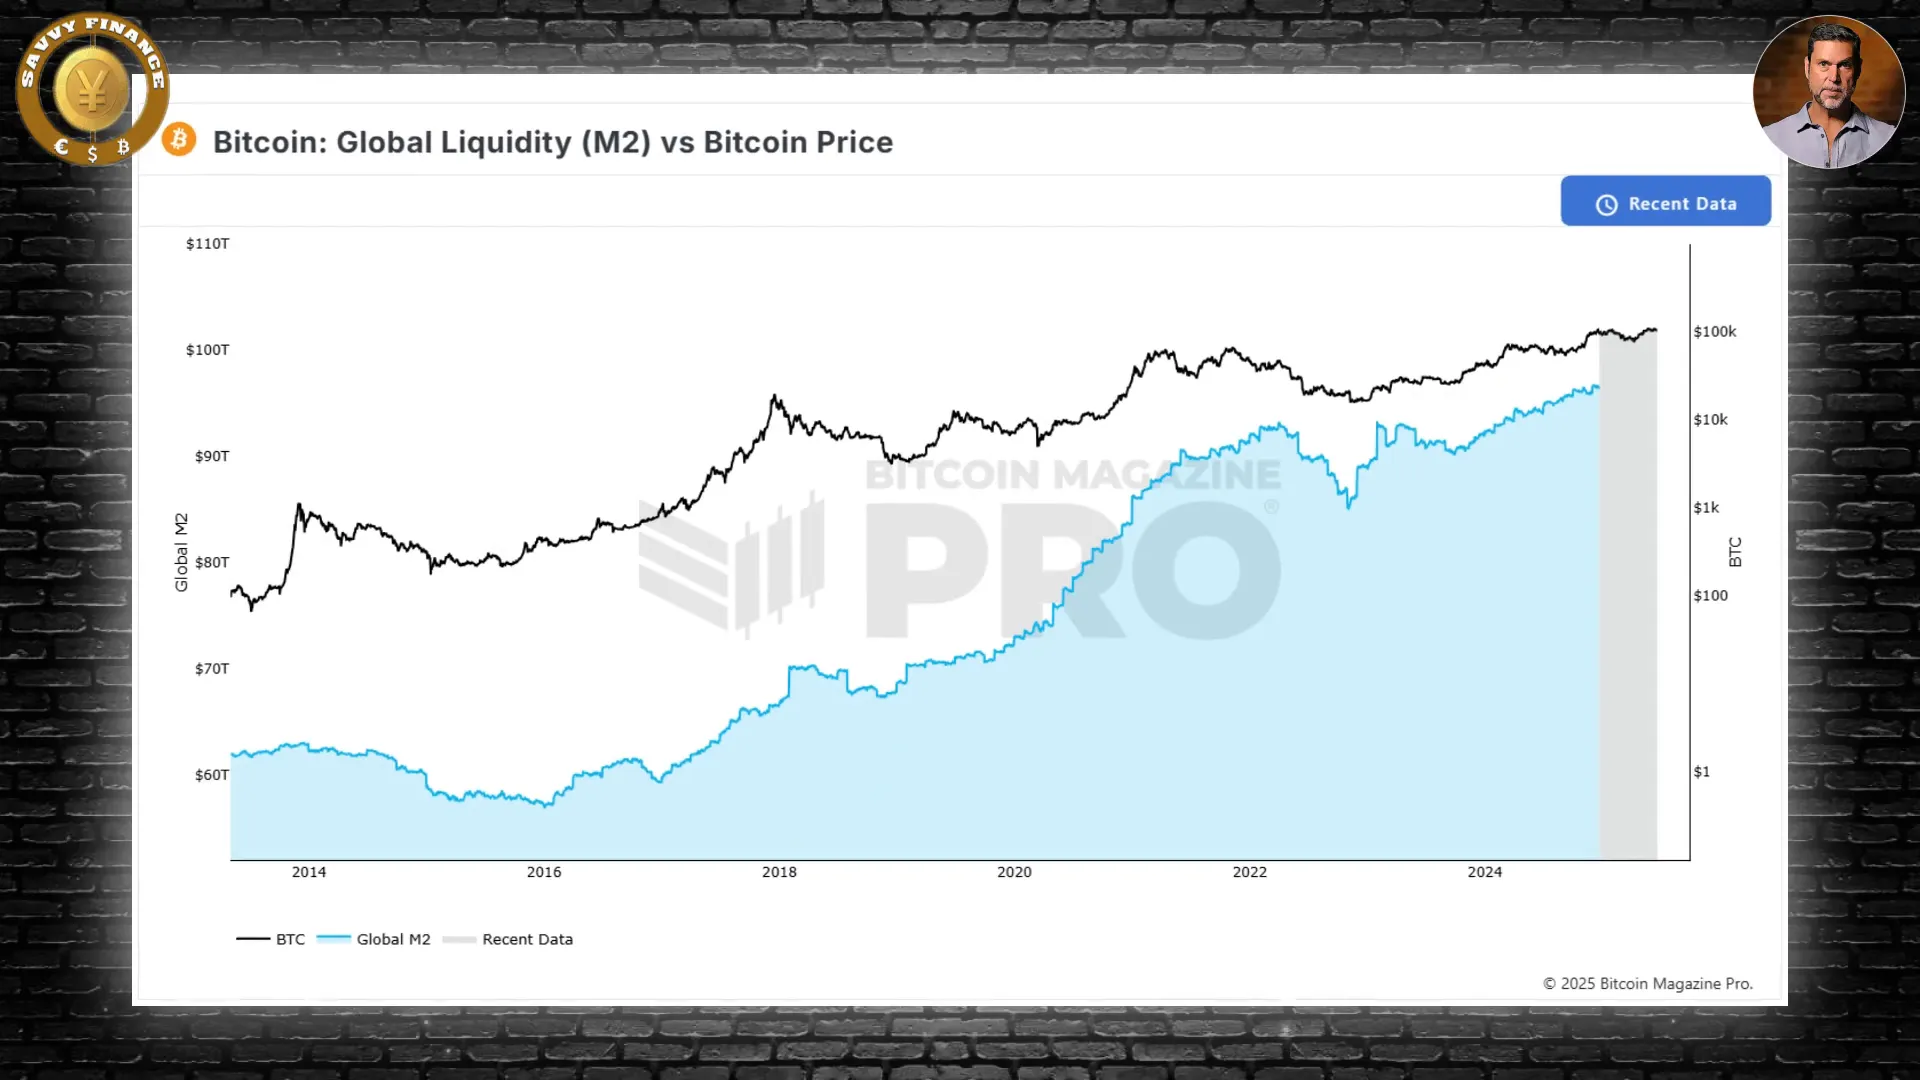
Global Liquidity: The Driving Force Behind Bitcoin’s Price Moves
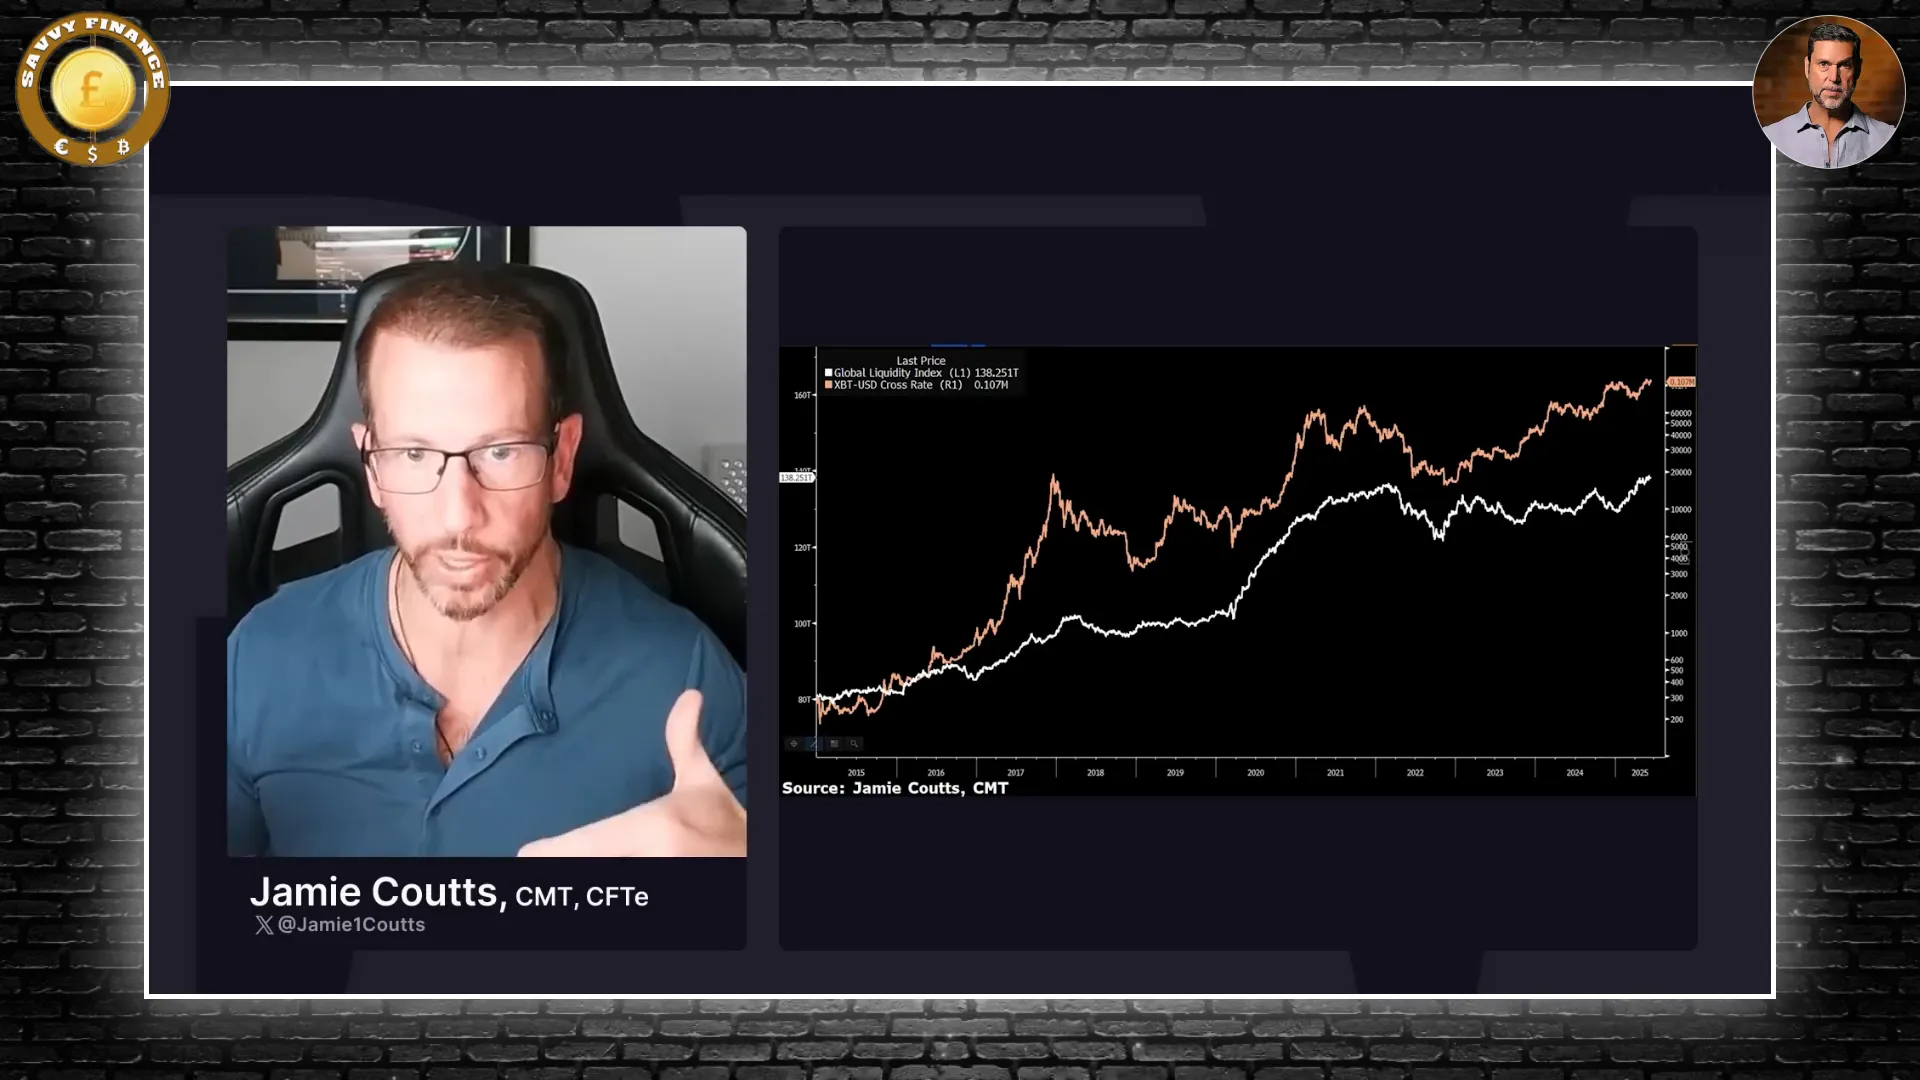
Jamie Coutts has developed a global liquidity index that closely tracks Bitcoin’s price movements with an impressive correlation of around 90%. This means that changes in global liquidity have historically been one of the strongest predictors of Bitcoin’s directional moves.
However, this relationship is not always linear. Bitcoin tends to become hypersensitive to liquidity changes during certain regimes. For example, when liquidity contracts or moves sideways, Bitcoin often peaks before liquidity tops out. This is because markets price in inflation and central bank policy pivots months in advance.
Historically, liquidity contraction periods have lasted between two to three years. The recent contraction from 2018 to 2022 was unusually long, but we are now breaking out of this phase, signaling what Coutts calls a “super bullish liquidity regime.”
Why Breaking Out of Liquidity Contraction Matters
Global liquidity cannot remain contracted indefinitely. The system’s massive indebtedness means rising default risks and excessive interest costs force central banks and institutions to add liquidity eventually. Think of it like a beach ball pushed underwater — the longer it’s held down, the stronger the bounce back.
When global liquidity breaks out to new all-time highs, Bitcoin’s sensitivity to liquidity changes can multiply by three to five times or more. In normal conditions, a 1% increase in liquidity might push Bitcoin up by 7%, but during these bullish regimes, the same liquidity expansion can lead to 20-30% price increases.
Low Leverage and Balanced Positioning: Signs of a Healthy Market
Another key insight is that market tops are generally preceded by excessive leverage, imbalanced positioning, and overheated speculative behavior. In early 2024, despite a 40% rally off April lows, leverage remains low, positioning is balanced, and the market shows no signs of excessive froth.
This contrasts sharply with the Q1 2024 surge fueled by ETF launches, where leverage and derivatives positioning were excessive — a setup that inevitably led to a 25-30% correction. The current environment, by comparison, is much more muted and sustainable.
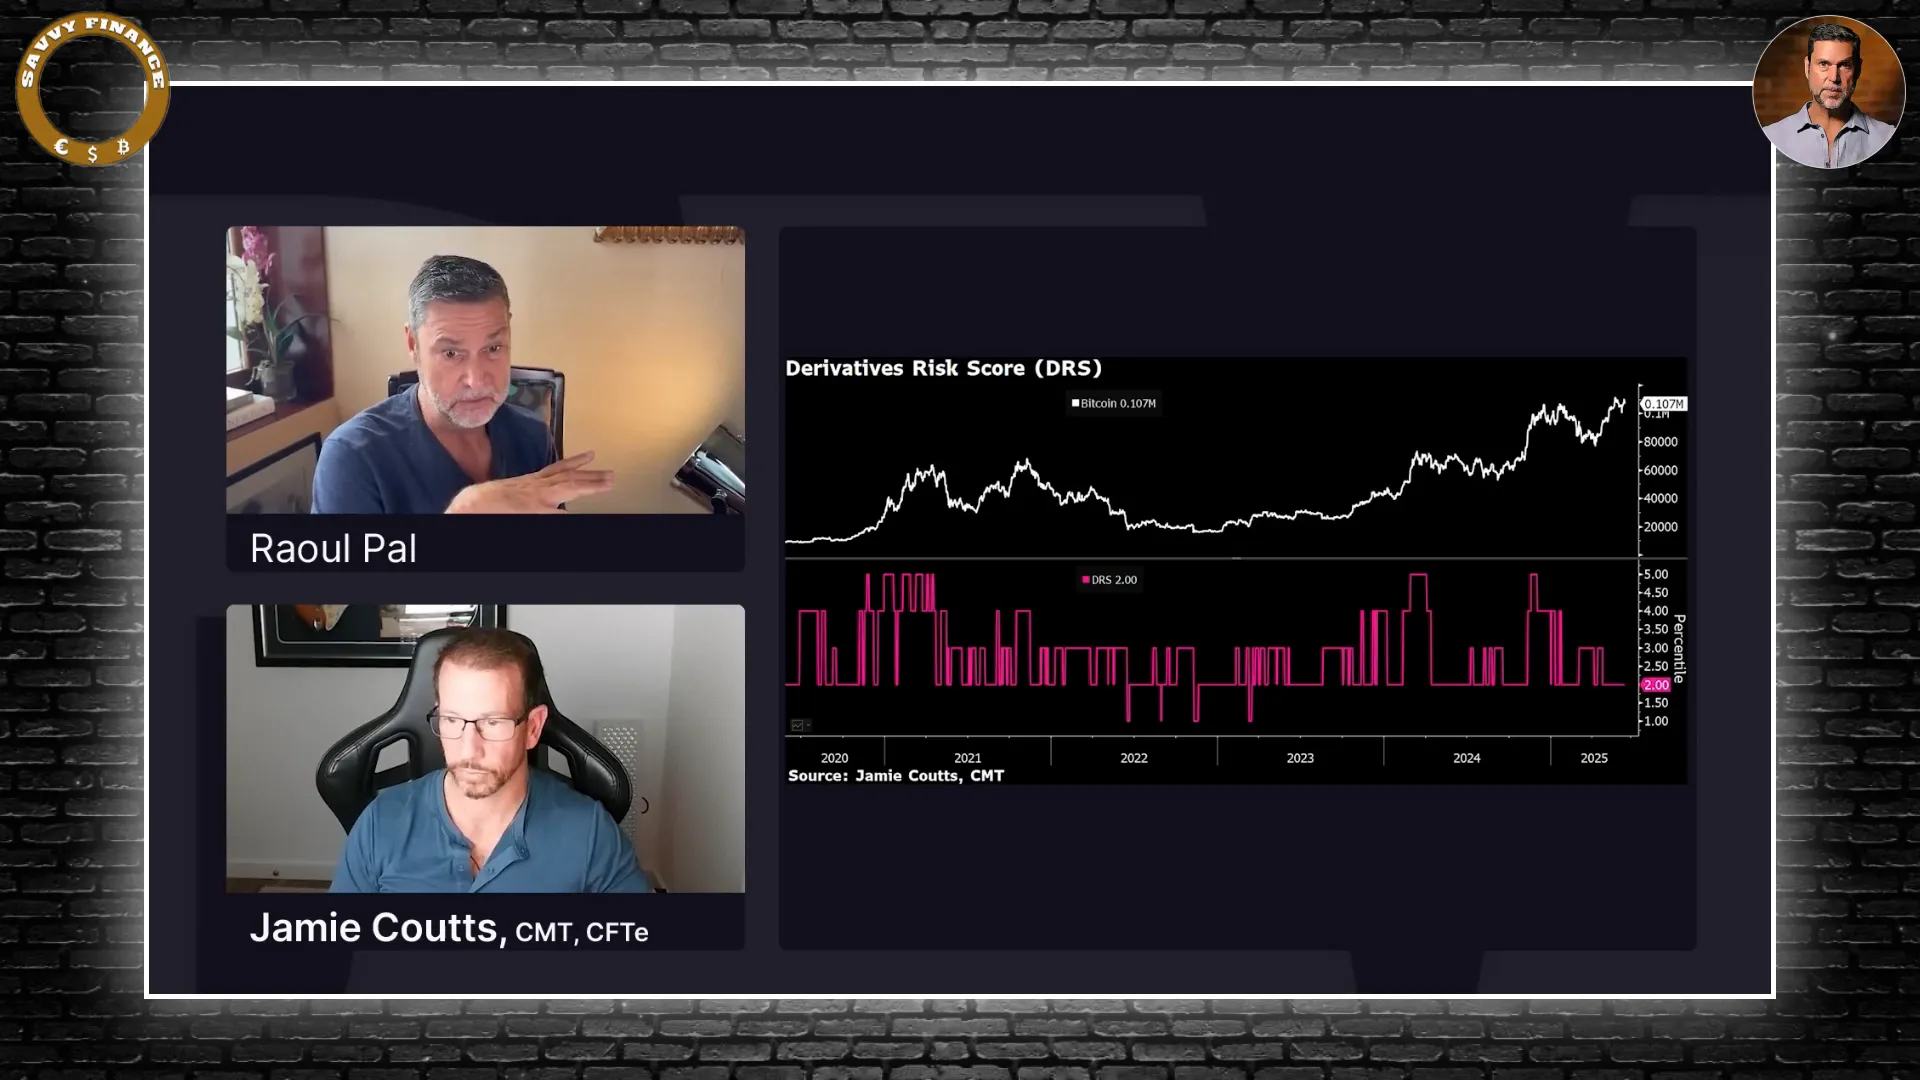
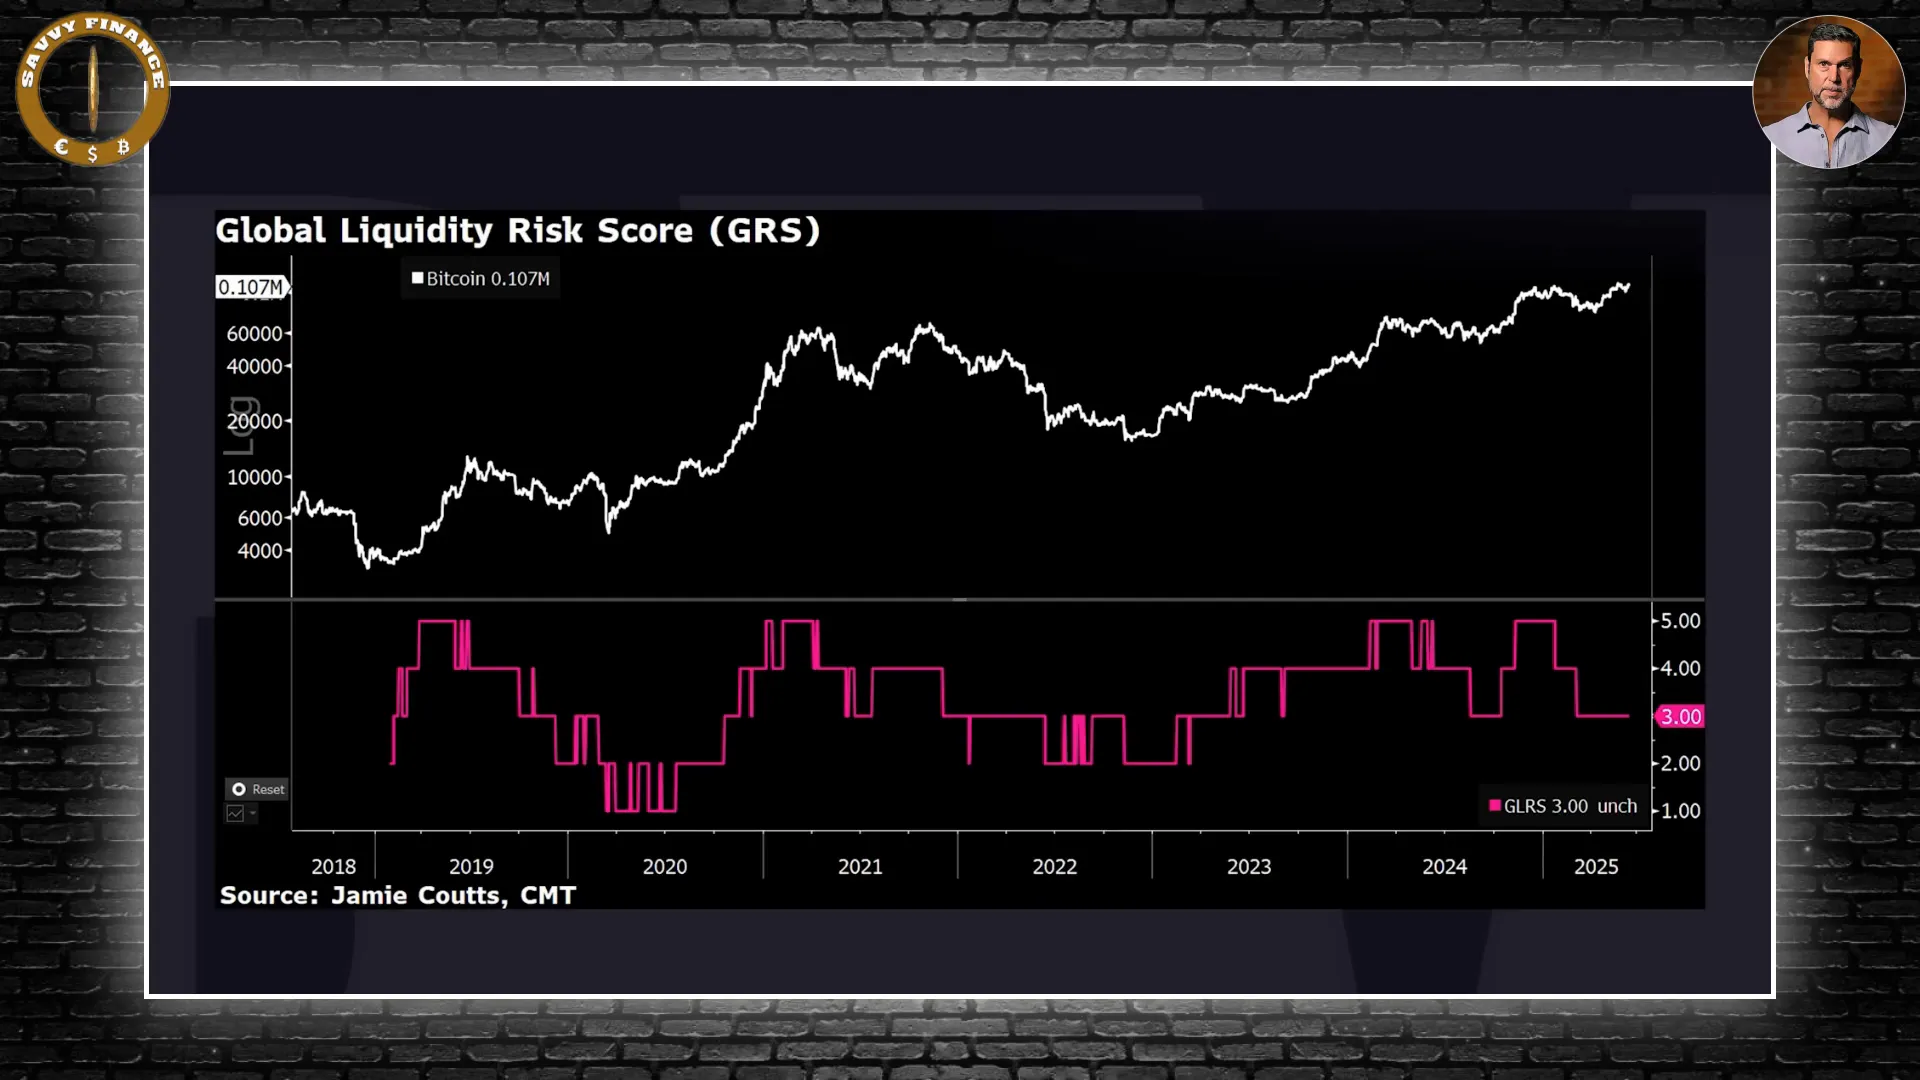
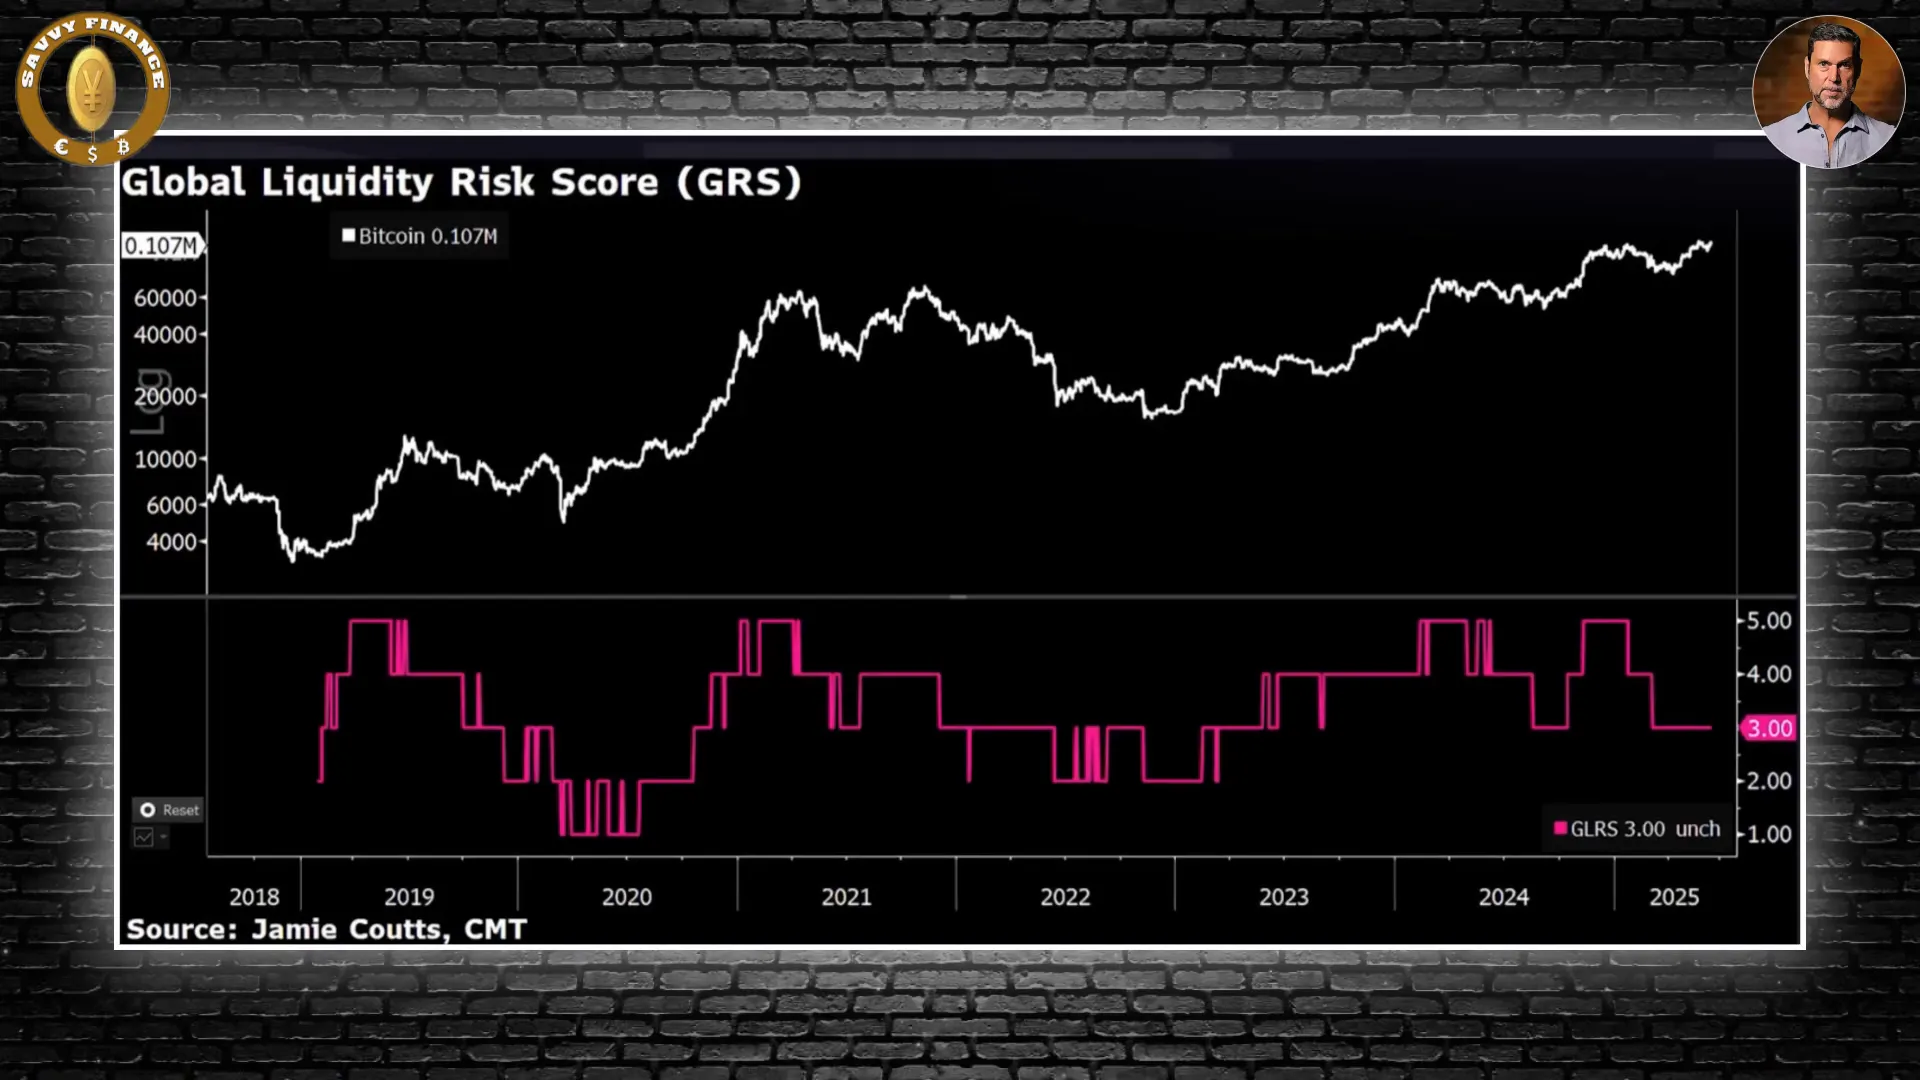
Introducing the Global Liquidity Risk Score: A Real-Time Dashboard for Cycle Timing
Jamie Coutts has transformed the relationship between liquidity and Bitcoin into a dynamic risk score system ranging from 1 to 5. This score helps investors gauge market conditions in real time:
- Below 4: Neutral or normal market conditions
- 4 and above: Signals caution, potential chips to take off the table
This system is similar to a weekly RSI indicator but calibrated specifically to liquidity trends. It doesn’t catch exact tops or bottoms but highlights when the market is stretched relative to liquidity — often a precursor to corrections or cycle shifts.
The model also incorporates leverage and unrealized profit data, providing a comprehensive view of market risk and potential turning points.
Why We’re Early in the Cycle, Not Late
Market tops tend to occur late, after liquidity has already peaked and speculative excesses build up. Conversely, bottoms usually coincide with central bank pivots and liquidity injections. The end of 2022 marked such a bottom, and current conditions suggest we are still early in the next leg up.
With global liquidity breaking out after the longest contraction in over a decade, and with low leverage and balanced positioning, the setup points to a longer, more sustainable crypto cycle. This cycle could be characterized by:
- Institutional capital flows
- Technological adoption at scale
- Alignment with macroeconomic trends
Unlike past cycles that were driven by short bursts of speculative mania, this one may stretch well beyond what most market participants currently expect.
What This Means for Cryptocurrency Investors
If global liquidity continues to expand by even a few percentage points, Bitcoin’s price could respond exponentially, amplified by the increased sensitivity during this bullish regime. The sovereign wealth funds’ growing interest and blockchain infrastructure adoption add a powerful tailwind on top of this macro setup.
Investors should watch the liquidity risk score, leverage levels, and positioning to navigate volatility with discipline. Right now, the dashboard is flashing green, signaling a healthy market environment that supports higher prices and a longer-lasting market regime.
Conclusion: A New Era for Bitcoin and Cryptocurrency
The current cryptocurrency cycle differs fundamentally from previous ones. It’s less about hype and more about structural factors: capital flows, macroeconomic dynamics, and institutional maturity. The combination of a breakout in global liquidity, low leverage, and balanced market positioning creates a fertile environment for sustained growth in Bitcoin and crypto markets.
While no one can predict the future with certainty, the data-driven frameworks from Raoul Pal and Jamie Coutts suggest that we are on the cusp of what could be a prolonged and significant crypto cycle. For those looking to position themselves ahead of the next major leg up, understanding these macro signals and liquidity dynamics is essential.
What do you think? Are we entering the early phase of a longer crypto cycle, or could this be another market head fake? The charts and liquidity trends suggest exciting possibilities ahead.
Cryptocurrency and Bitcoin: Why the Real Bull Market Is Just Beginning. There are any Cryptocurrency and Bitcoin: Why the Real Bull Market Is Just Beginning in here.

