
In the ever-evolving world of Bitcoin, crypto, and blockchain, staying ahead of market movements is crucial for any serious investor. As we navigate the turbulent waters of June 2025, recent developments have introduced fresh uncertainty and opportunity alike. The global financial landscape is shifting, influenced by escalating geopolitical tensions and rippling effects across traditional and digital markets.
Let’s dive deep into the current state of Bitcoin, explore key technical and macroeconomic levels, and understand what this means for the future trajectory of BTC and the broader crypto ecosystem. This analysis will also touch on related markets like the S&P 500 ETF (SPY) and gold, helping you form a comprehensive outlook on investing in this pivotal moment.
Setting the Stage: Bitcoin's Current Technical Landscape
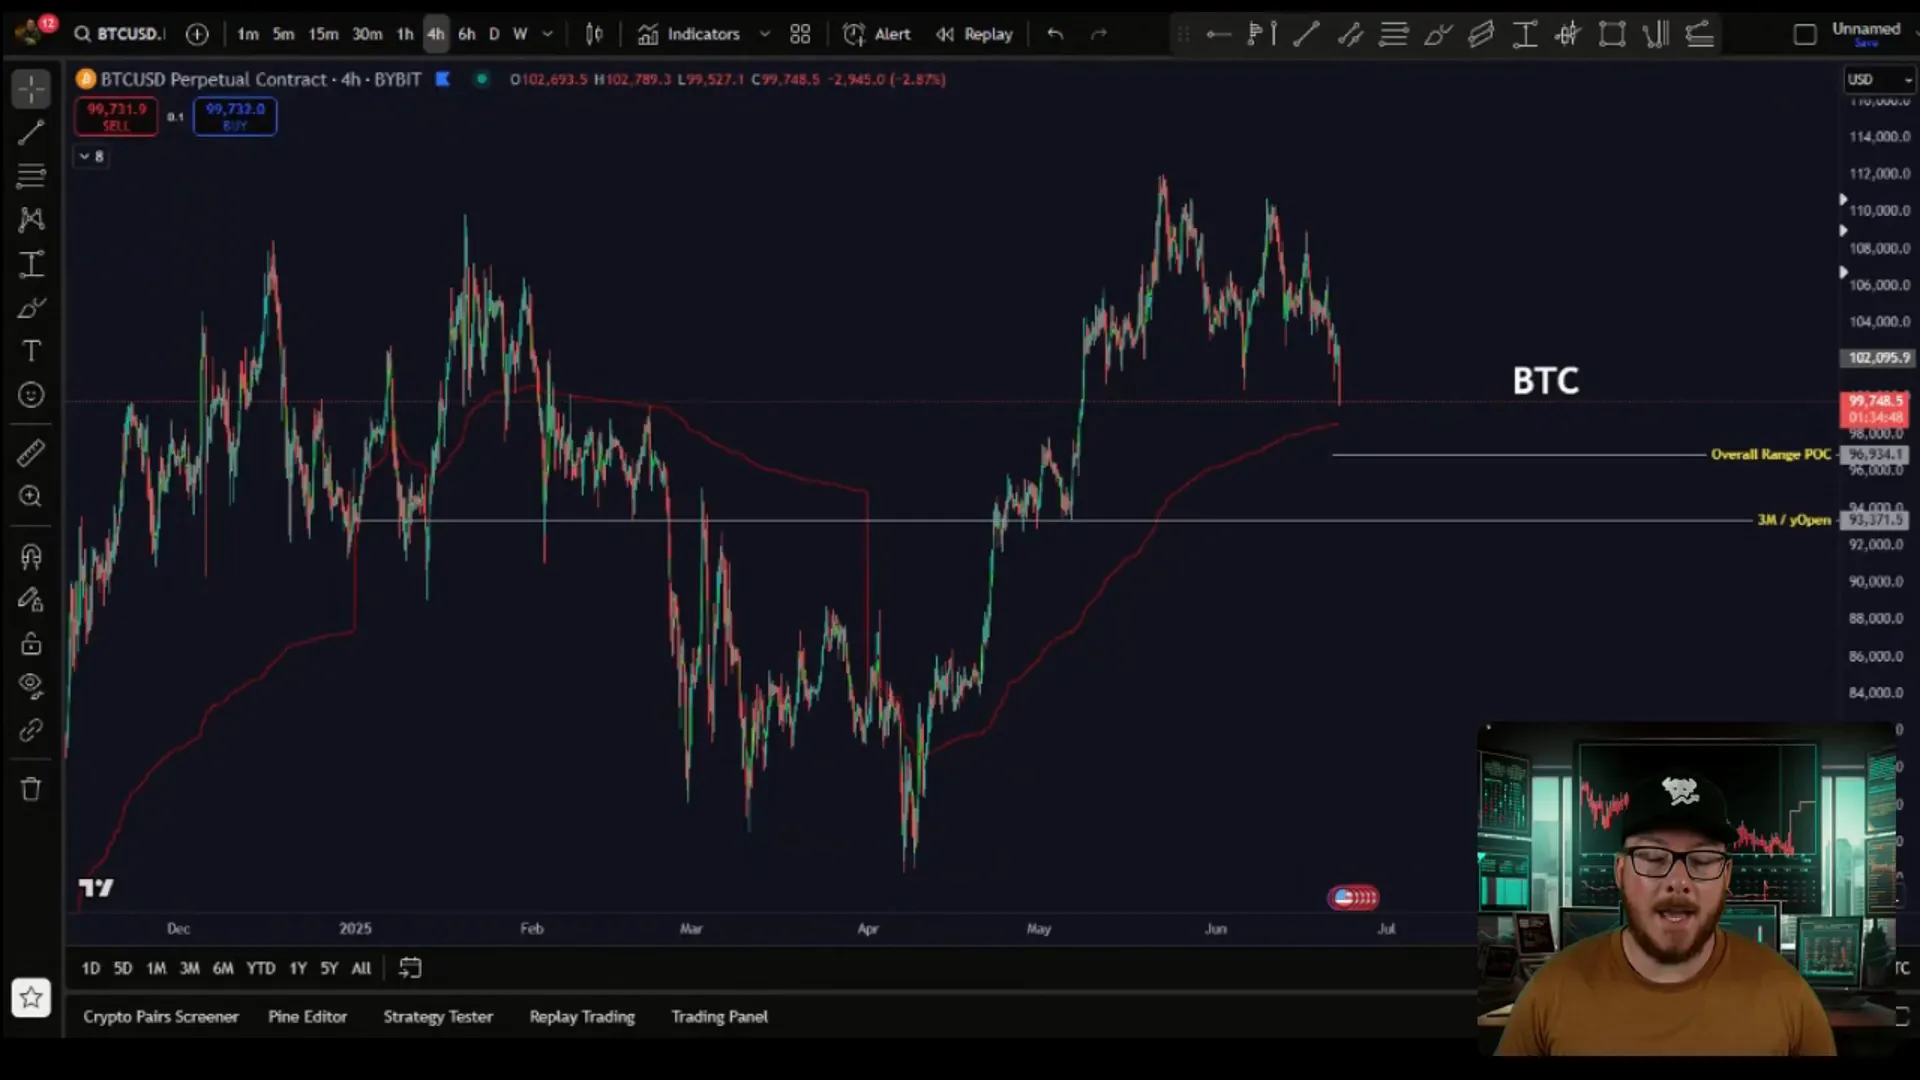
As of late June 2025, Bitcoin has been showing signs of a pullback, breaking below the psychologically significant $100,000 mark. At the time of analysis, BTC hovered around $99,000, a critical juncture that demands careful attention. This movement comes amid broader market weakness, with traditional equities also faltering. The backdrop? An escalation in global conflict that unfolded over the weekend while markets were closed, adding fuel to the fire of uncertainty.
Understanding Bitcoin’s short-term technical setup is vital before zooming out to the macro perspective. The current price action is highly technical, with key regions approaching that could define Bitcoin's next major move. It's important to recognize that news often peaks at market extremes—whether bullish or bearish—and these extremes frequently coincide with significant reversals.
For instance, looking back to Bitcoin's peak around the inauguration day earlier this year, the news flow was overwhelmingly bullish. We had the emergence of a crypto reserve, a new administration favorable to crypto, and broad optimism. Yet, despite this positive backdrop, price topped out and began to decline as tariff concerns and geopolitical risks intensified, pushing sentiment to extremes on the bearish side.
Key Price Zones to Watch
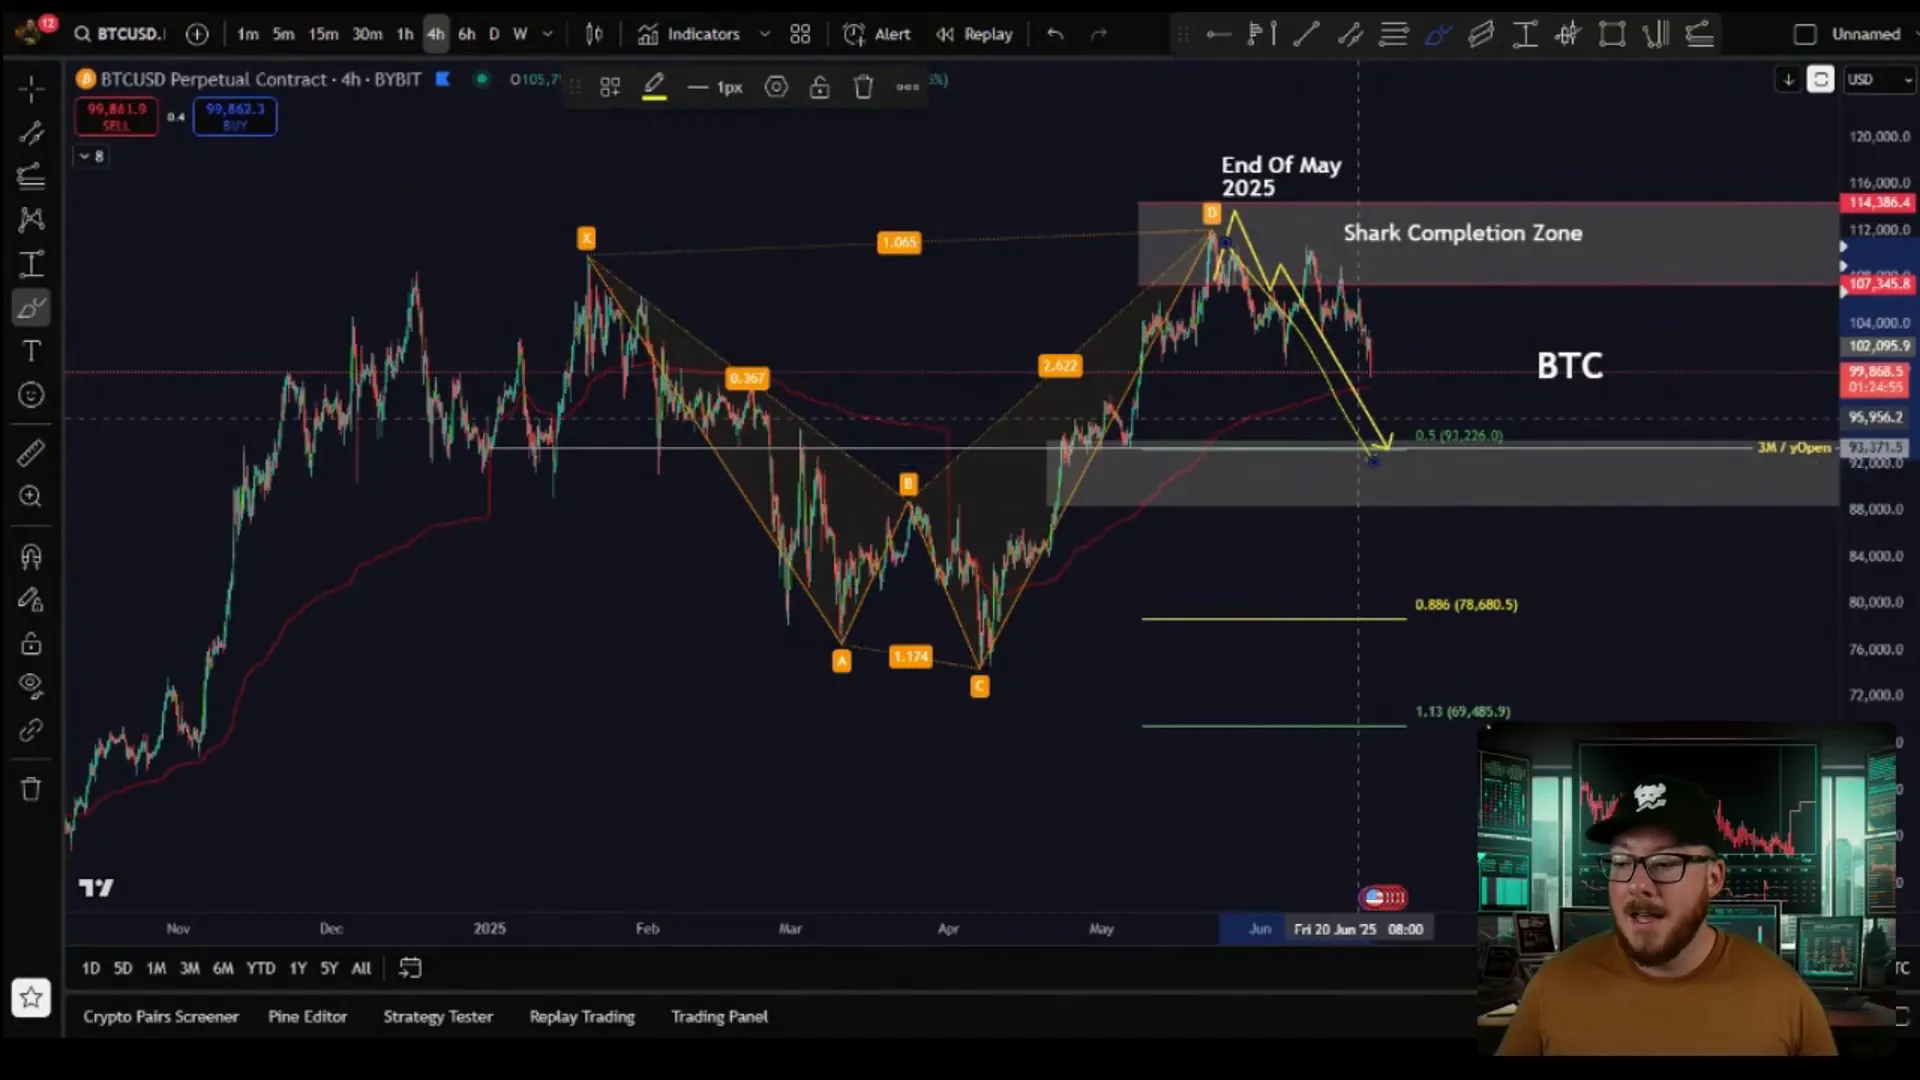
Currently, Bitcoin is approaching a major bearish setup that has been developing for over a month. The target zone lies approximately 7% below the current price, between $88,000 and $93,000. This range is critical as it aligns with multiple technical indicators and historic support levels. Here’s how I’m approaching the market:
- Lowest Tier Bounce: Around recent lows near $88,000.
- Point of Control (POC): Approximately $97,000, representing the highest traded volume area since November 2024.
- Potential Reversal Zone: Between $88,000 and $93,000, where a next leg higher could be launched if support holds.
This approach is grounded in analyzing the fixed range volume profile of Bitcoin’s trading since late 2024. The volume profile helps identify where price action tends to gravitate within the range, often retreating to the POC or rebounding from the range's bottom or top.
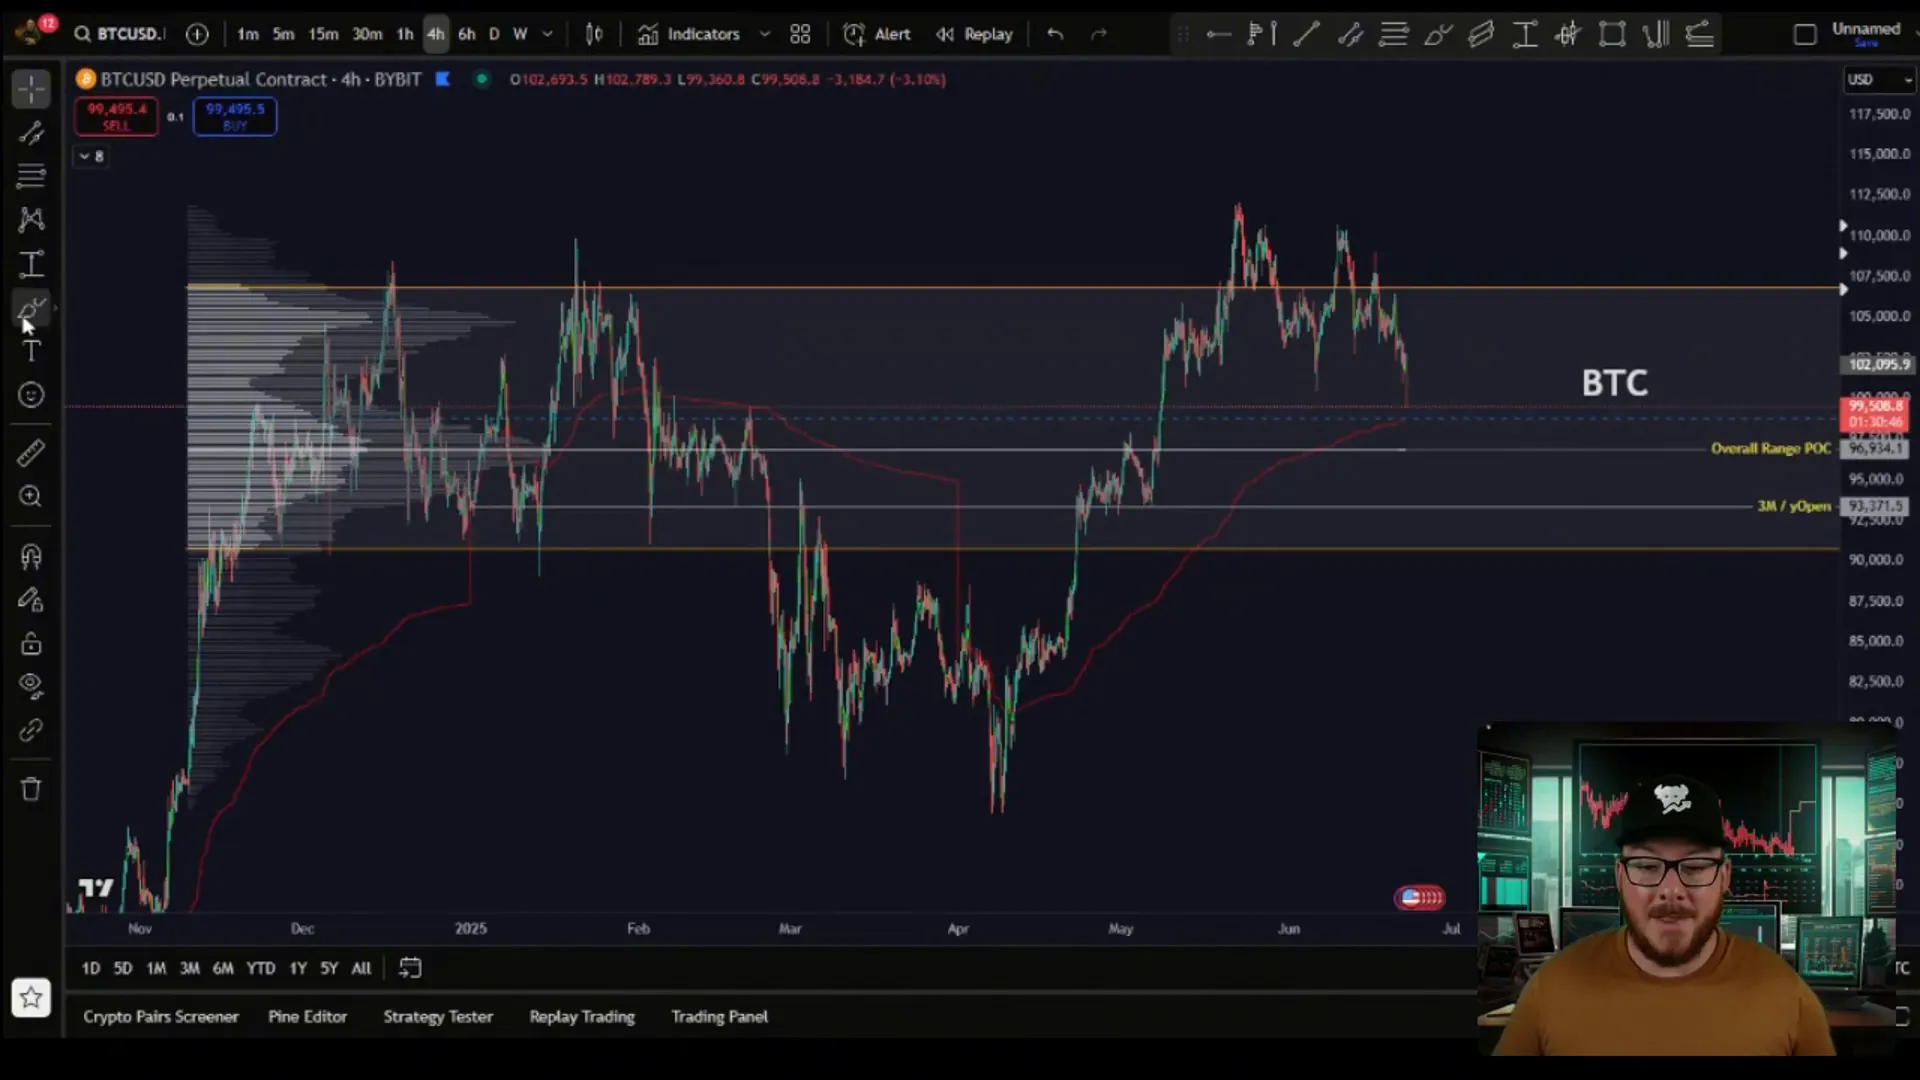
Think of this price action as a range rotation: Bitcoin initially rotated from lows to highs and now may be rotating back down from highs to lows. This cyclical movement is natural in markets and often sets the stage for significant moves once the range is broken.
Is a Bounce Imminent or a Deeper Drop Ahead?
One of the most common questions right now is whether Bitcoin will bounce from the $97,000 to $99,000 zone or continue falling towards the $88,000 to $93,000 support area. Analyzing the price action through the lens of an ABC correction pattern provides some clues.
Using Fibonacci extensions, the ABC setup projects a one-to-one retracement that aligns neatly with the $98,000 to $99,000 zone. This suggests that a short-term bounce could emerge here, especially if the market sentiment shifts mildly positive or if panic selling subsides.
However, it’s crucial to remain cautious. The weekend's geopolitical turmoil has injected fear and uncertainty into markets, often leading to exaggerated moves. Interestingly, history shows that Mondays expected to be sharply negative sometimes surprise with resilience or even gains, as traders and institutions absorb the weekend’s news.
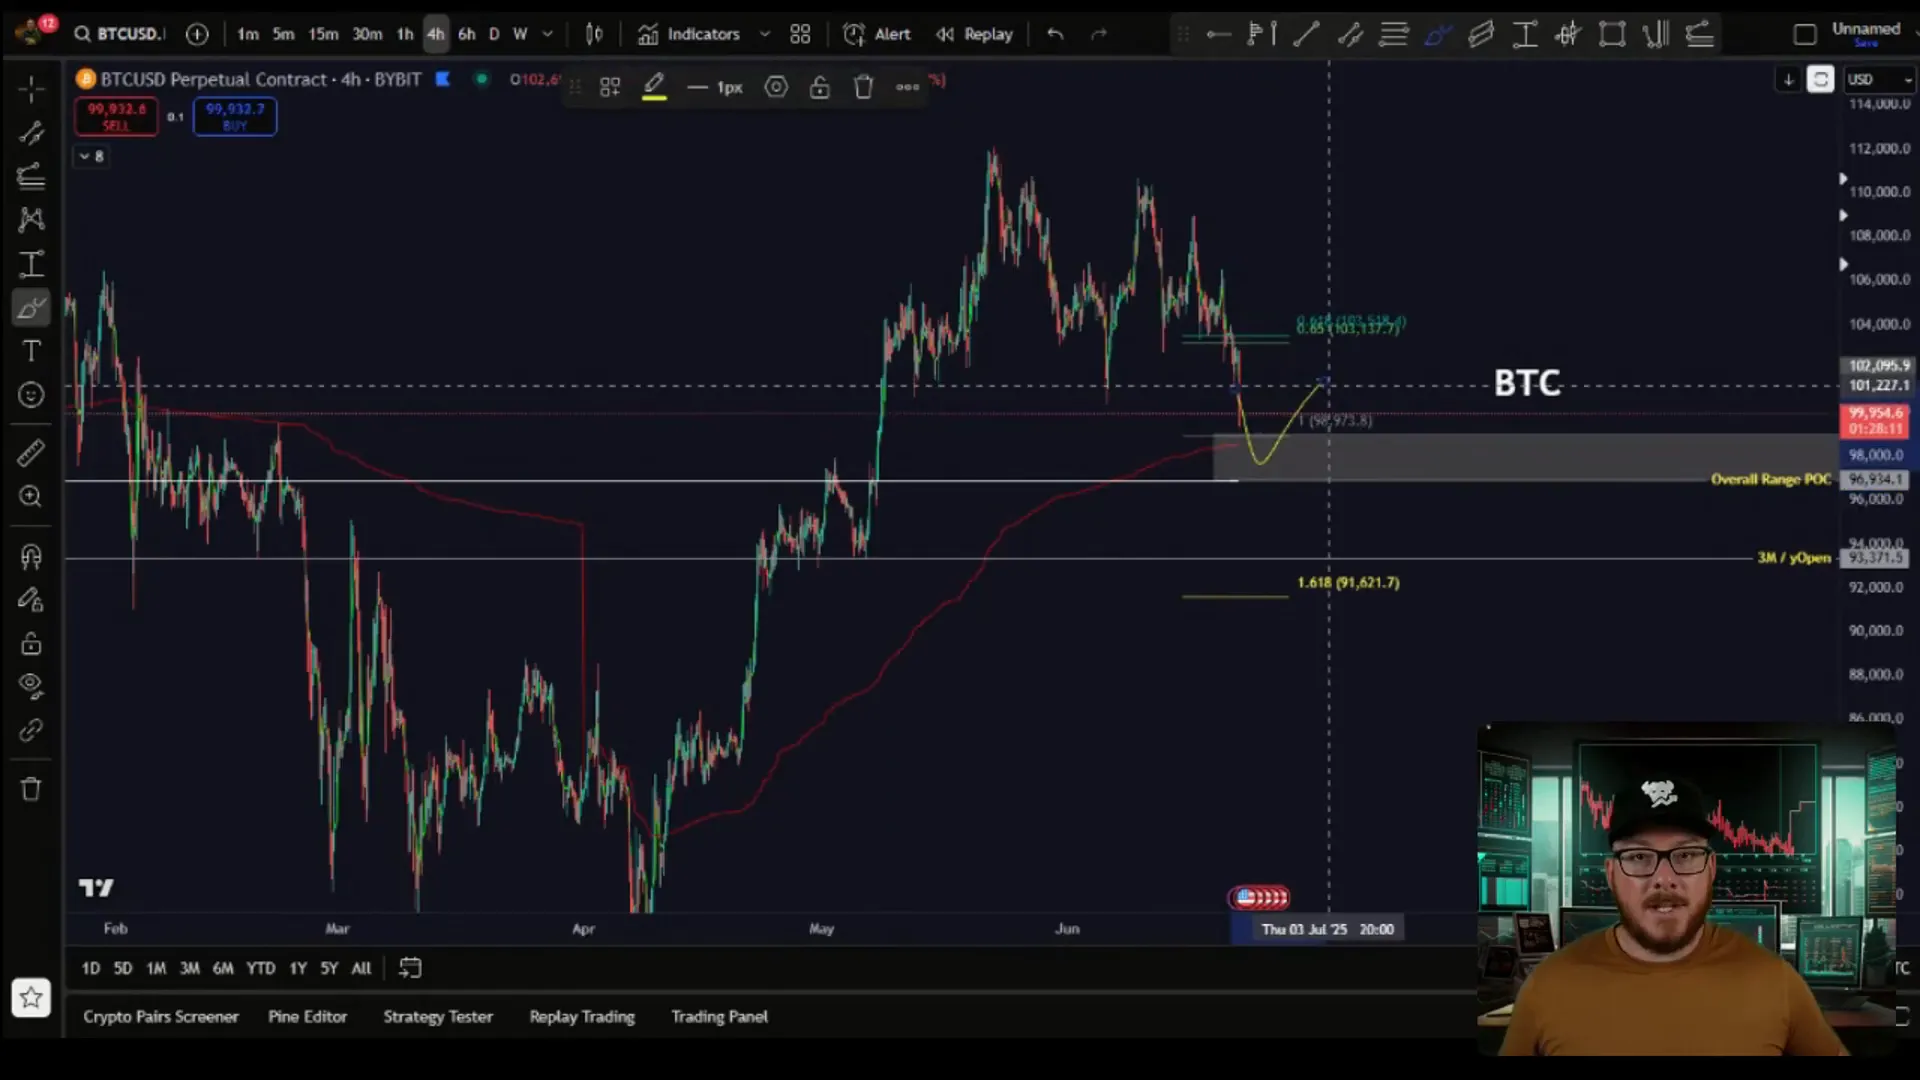
Despite the possibility of a bounce, the overarching thesis remains bearish until proven otherwise. The bearish setup is supported by a completed four-month bearish shark harmonic pattern, a complex Fibonacci-based structure that often signals significant reversals. The pattern’s key target lies around the 0.5 Fibonacci retracement level, coinciding with the $88,000 to $93,000 zone.
The "Box of Despair" and What It Means
This target zone represents what I call the "box of despair" — a critical support area where Bitcoin could either find its footing for a strong reversal or break down further, leading to a more extended bearish phase. This box also aligns with major technical supports:
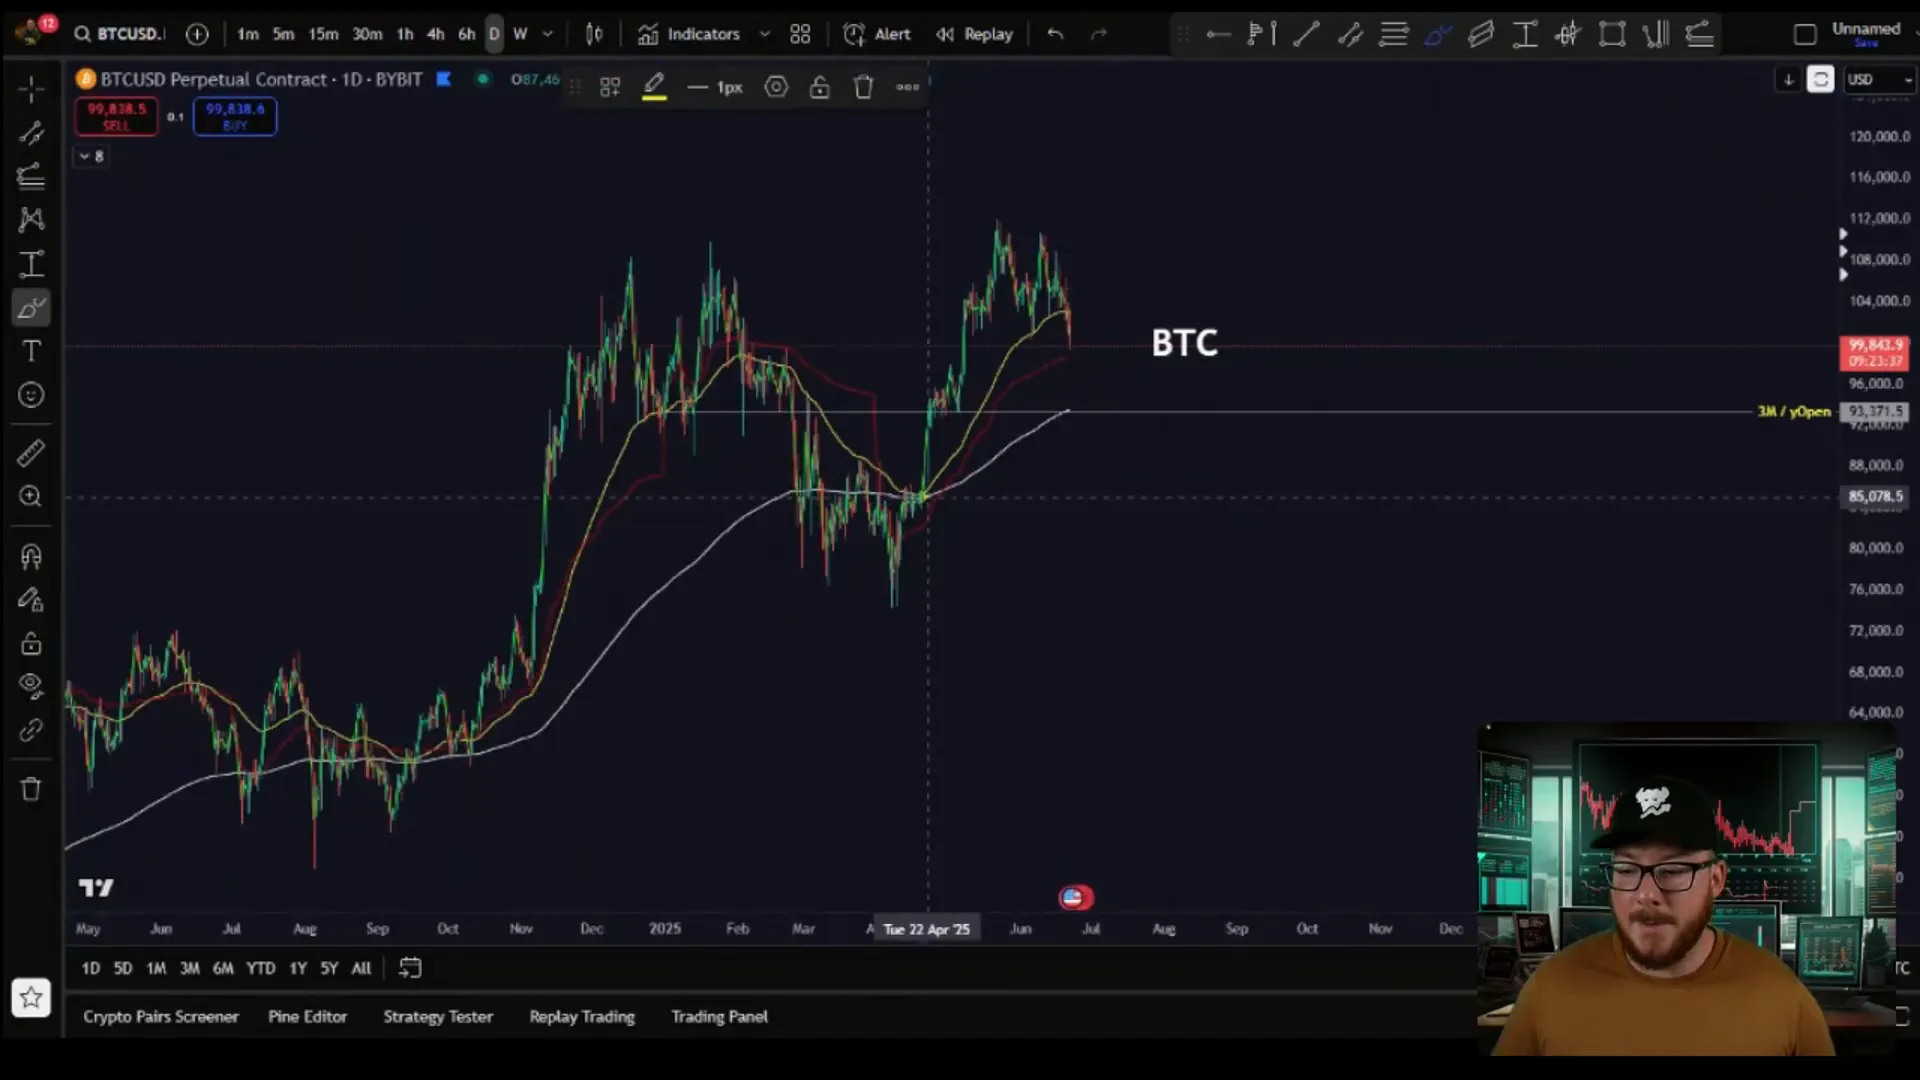
- Yearly Open Backtest: Historically, Bitcoin tends to revisit its yearly open price, which sits near this range.
- 200-Day EMA Support: The 200-day exponential moving average (EMA) serves as a strong dynamic support that often marks long-term trend shifts.
Should Bitcoin fall below this box decisively, the market structure would shift heavily towards the downside, and the bearish scenario would gain momentum. Conversely, holding above it could set the stage for a powerful recovery towards $115,000 and beyond.
Macro Outlook: Is $135K Still on the Horizon?
While short-term volatility and geopolitical uncertainty dominate headlines, the macro outlook for Bitcoin remains cautiously optimistic. The next major target for Bitcoin is still in the $130,000 to $135,000 range, potentially achievable by the end of September 2025, provided key support levels hold.
Reaching this target would require Bitcoin to first reclaim and sustain a breakout above the $115,000 resistance zone, often referred to as the "gold pocket" — a Fibonacci confluence area that historically acts as a strong barrier or launchpad for price moves.
Even with the current volatility, the underlying demand drivers for Bitcoin remain intact, supported by institutional inflows and growing adoption. Let’s take a closer look at some of these factors.
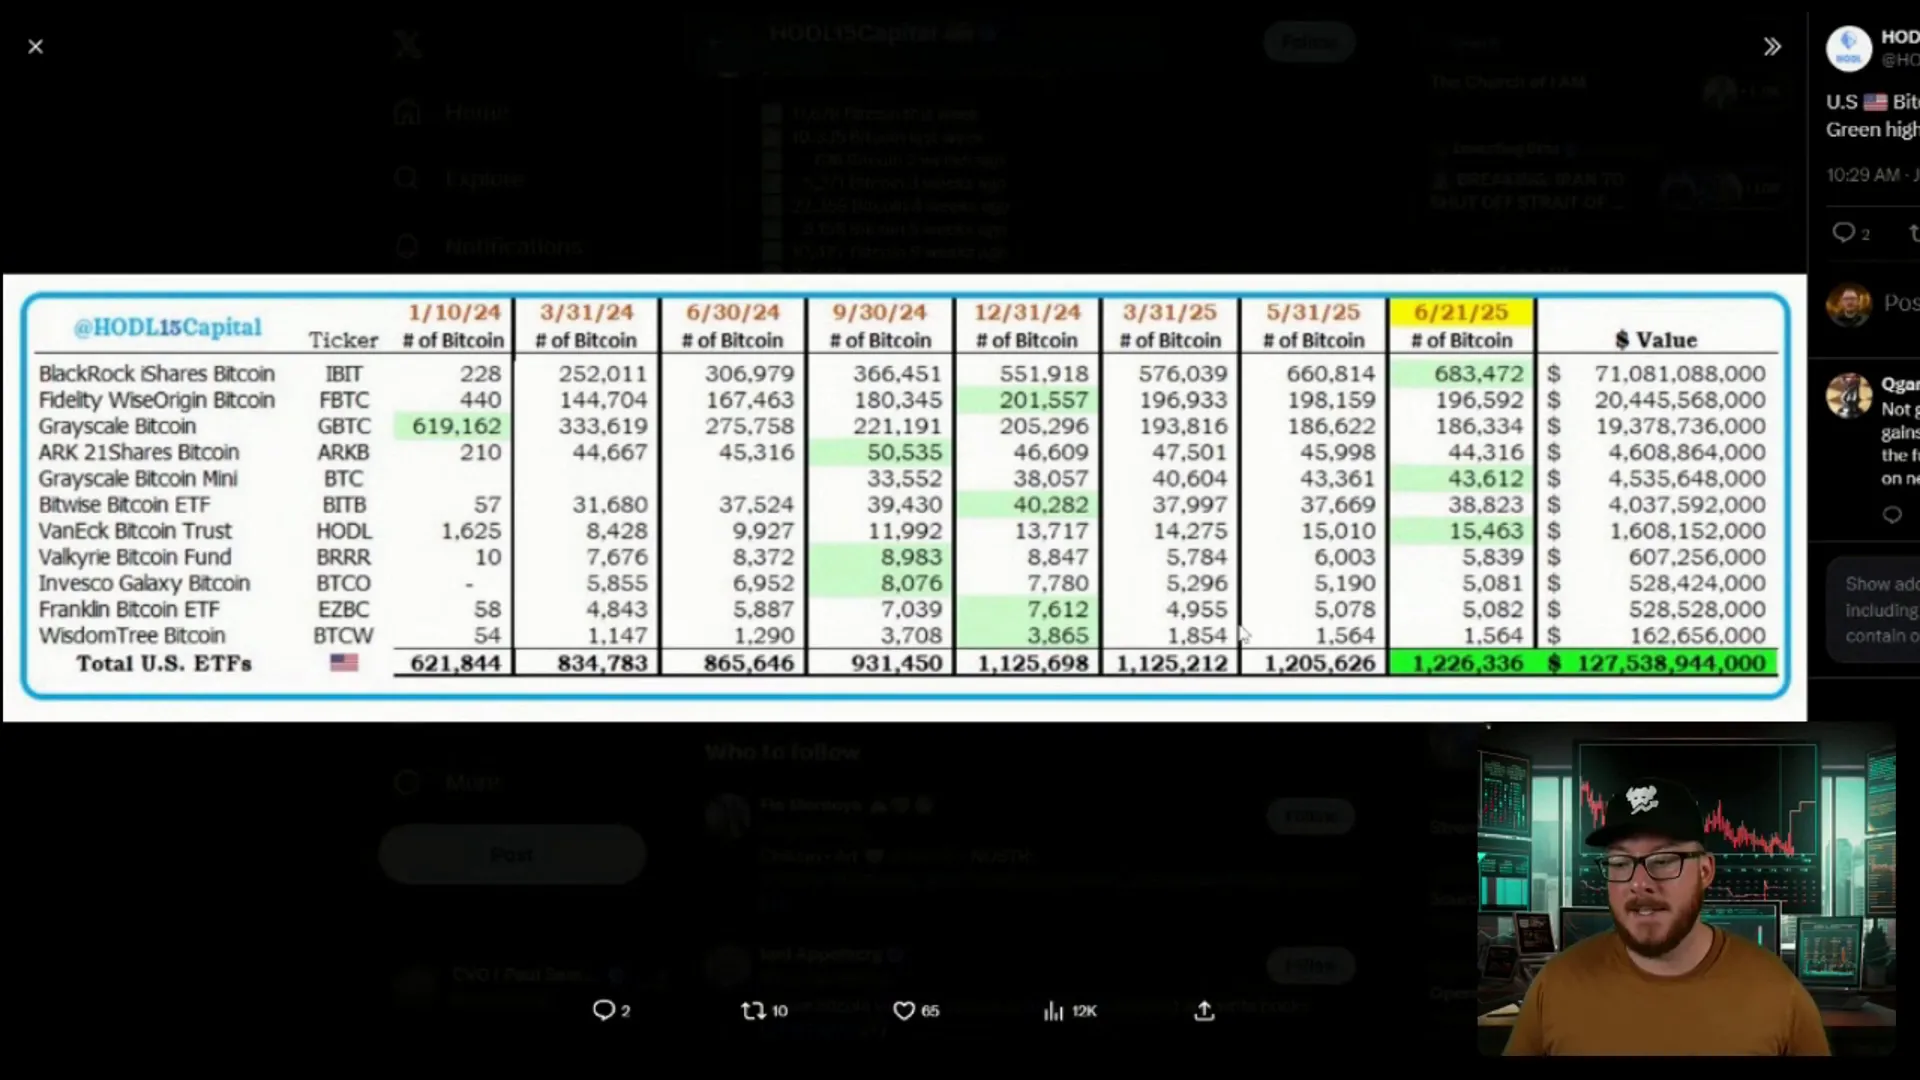
ETF Inflows: A Sign of Institutional Confidence
One of the most bullish indicators in recent months has been the steady increase in Bitcoin ETF inflows. Despite some short pauses and slowdowns, over 20 million Bitcoin have been added to ETF reserves in the past month alone. This accumulation signals growing institutional interest and a strengthening supply-demand dynamic that should support higher prices over time.
It’s worth noting that even with ETF inflows increasing, Bitcoin has experienced multiple pullbacks, including notable corrections from $72,000 to $48,000 in 2024 and from $110,000 to $74,000 earlier this year. These corrections are typical market behavior and underscore the importance of patience and disciplined risk management for investors.
Fear & Greed Index: Sentiment Still Shifting
The Fear & Greed Index offers additional insight into market psychology. Currently, the index reads as relatively neutral, even slightly leaning towards greed. However, on the ground, sentiment feels more fearful due to the recent news and price action. This disparity suggests that fear may be underrepresented in the index, highlighting a potential oversold condition.
Historically, extreme fear or greed levels often precede major market reversals. Since we’re not yet at either extreme, the market could still swing in either direction in the near term. However, should Bitcoin reach the $88,000 to $93,000 support zone, it’s likely that fear would intensify, potentially setting up a strong buying opportunity as panic subsides.
Watching the S&P 500 (SPY) and Gold for Broader Market Clues
Bitcoin doesn't operate in isolation. Traditional markets like the S&P 500 ETF (SPY) and commodities such as gold often provide context and confirmation for crypto market moves.
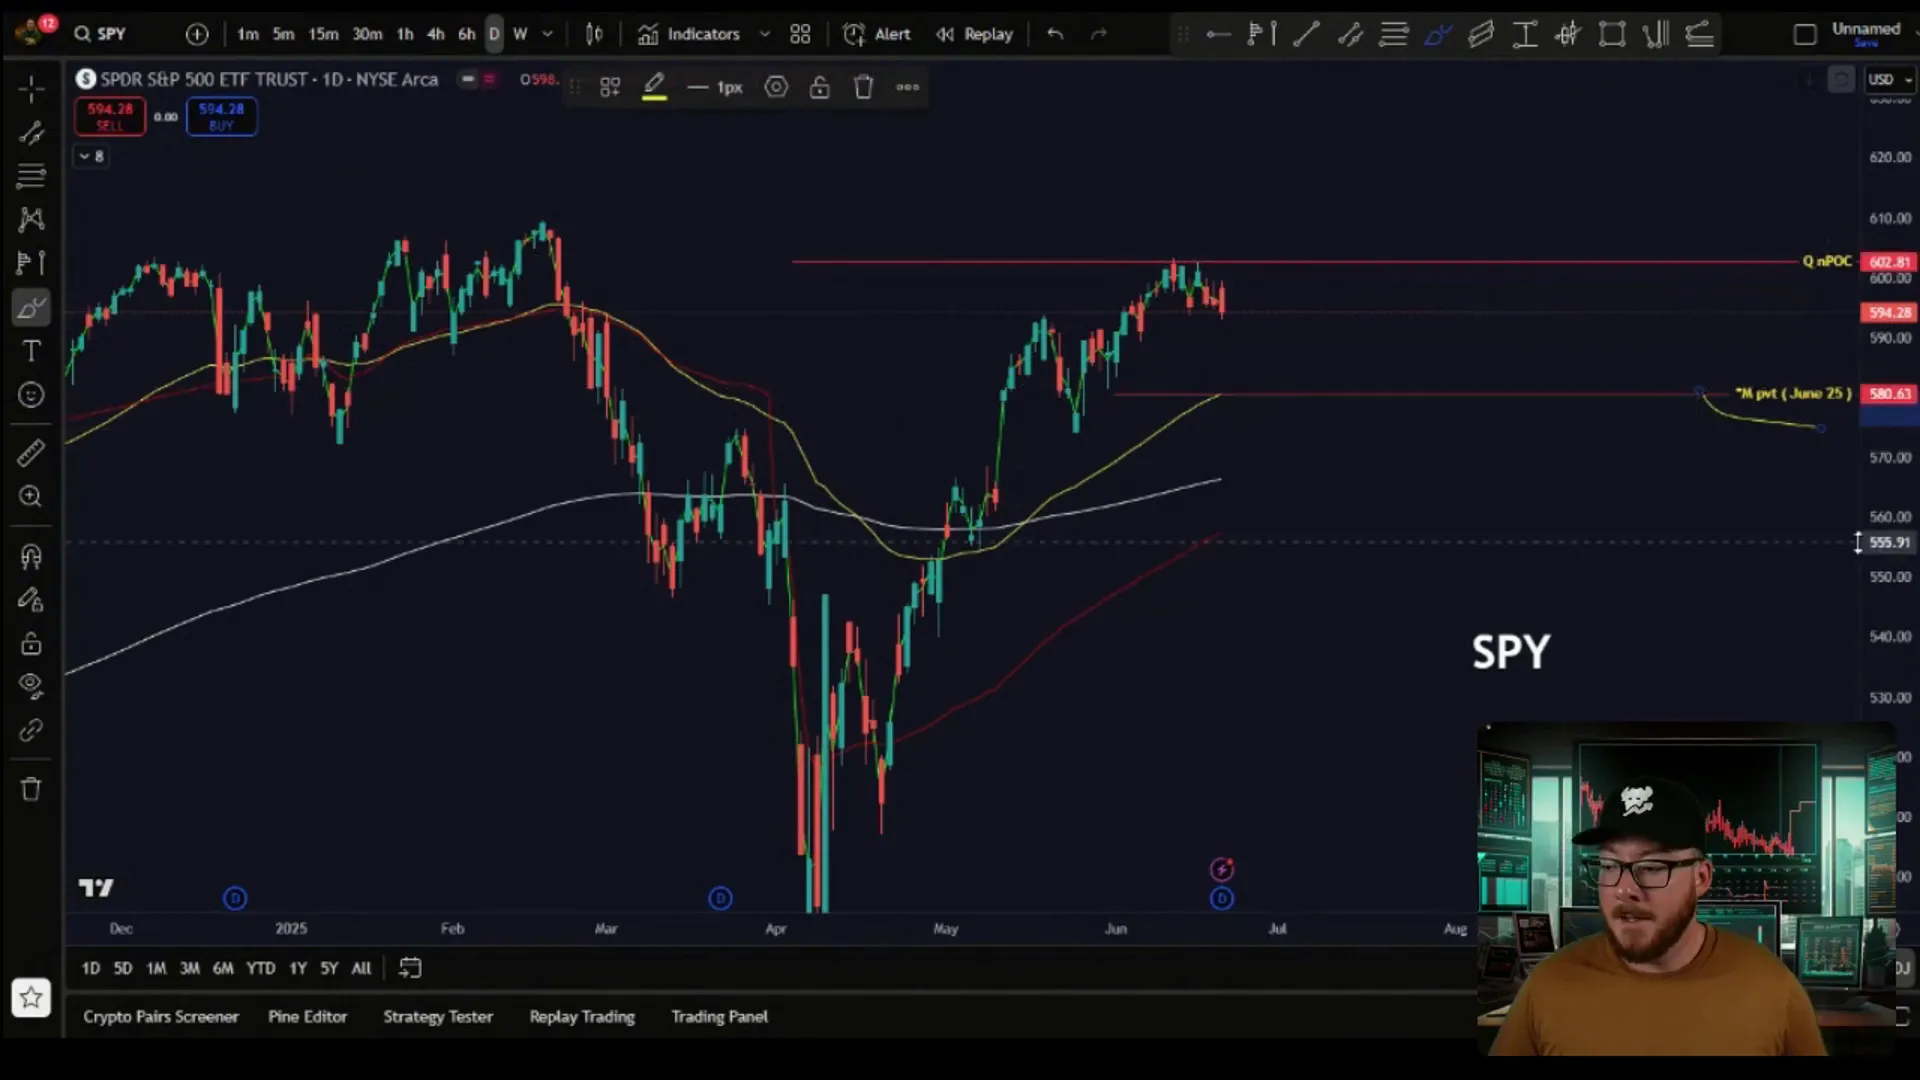
SPY: Key Support and Resistance Levels
The SPY has recently reached a quarterly NPOC (Naked Point of Control) from the previous quarter, acting as a resistance area. Below current prices lie untapped monthly pivots and moving averages that could provide support during pullbacks.
Key levels to watch on the downside include:
- Support Zone: $565 to $580, coinciding with the 50-day and 200-day moving averages.
- Deeper Retracement: Around $556, aligning with the quarterly VWAP and a Fibonacci 38.2% retracement.
These zones represent potential areas where SPY could stabilize before resuming an upward trend or breaking lower, which would likely increase fear across global markets, impacting Bitcoin and other assets.
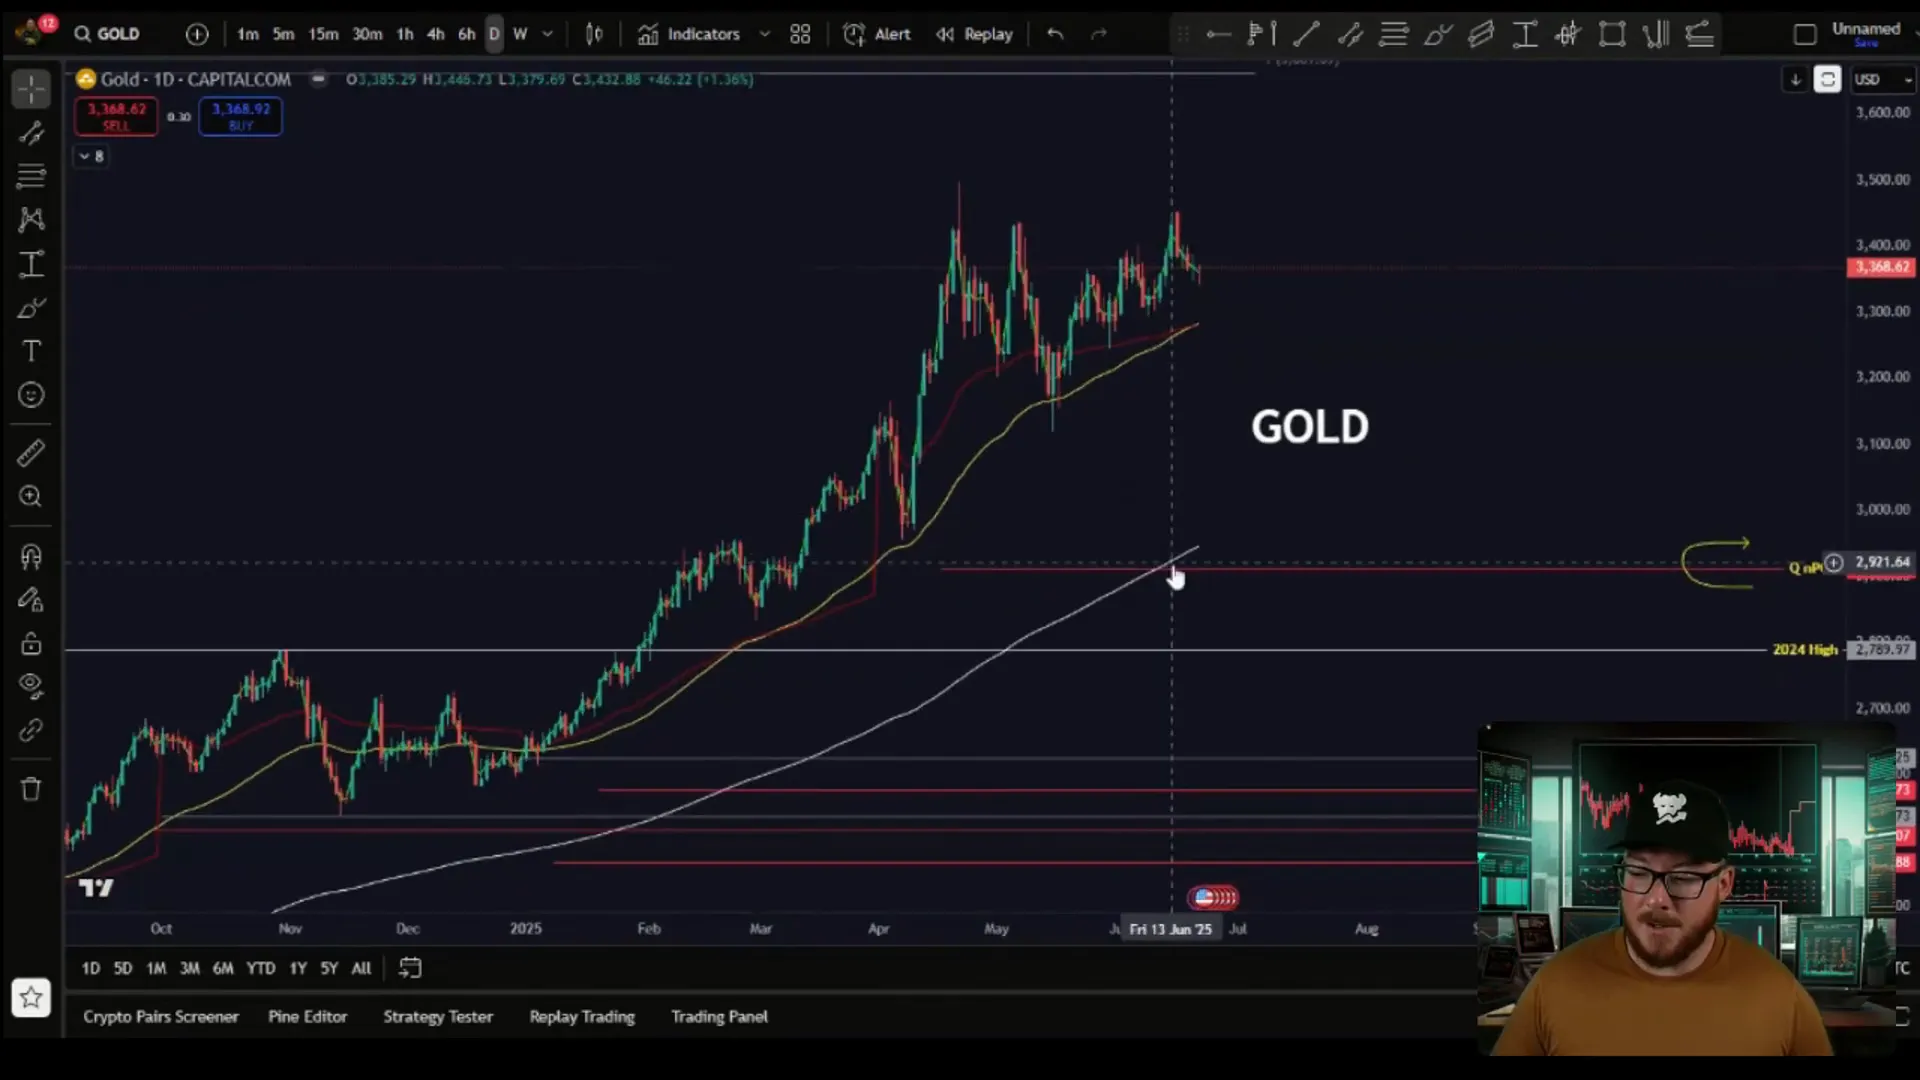
Gold: Watching for Entry Points Amid Volatility
Gold remains a traditional safe-haven asset, and its price action often reflects broader risk sentiment. While recent price moves have invalidated some bullish breakout patterns, the target remains near $3,600 on the upside.
On the downside, significant support zones include:
- Short-term Support: The 50-day EMA near $3,283.
- Major Support: The 200-day moving average around $2,900, representing a deeper correction zone (approximately 12-13% pullback).
For investors interested in gold, the $2,900 to $3,000 range presents an attractive buying opportunity if prices pull back sufficiently. This area could also provide clues about broader market risk appetite, influencing decisions in Bitcoin and crypto.
Strategic Takeaways for Bitcoin and Crypto Investors
Given the current landscape, here are some actionable insights for investors focused on Bitcoin, crypto, and blockchain technologies:
- Monitor the $88,000 to $93,000 Support Zone: This range represents a critical inflection point. A strong hold here could signal the start of the next bullish leg, while a break below may lead to further downside.
- Watch for ABC Correction Patterns: Short-term bounces to the $97,000 to $99,000 zone are plausible. Use these as potential entry or exit points depending on your risk tolerance.
- Keep an Eye on Institutional Flows: ETF inflows continue to support the macro bull case. Sustained accumulation by institutions is a positive sign for long-term investors.
- Stay Alert to Geopolitical and Macro News: Unexpected global events can cause sharp volatility. Incorporate these factors into your risk management strategy.
- Use Technical Indicators like the 200-day EMA: This moving average has historically provided strong support during corrections and can guide your entry and exit decisions.
- Consider Broader Market Signals: Movements in SPY and gold can provide early warnings or confirmations of market sentiment shifts.
Ultimately, patience and discipline remain paramount. The crypto market’s inherent volatility offers both risks and rewards, and understanding the technical and macro context is key to navigating it successfully.
Investing with Confidence in Uncertain Times
Bitcoin and the broader crypto markets are at a crossroads. While short-term volatility and geopolitical tensions add layers of complexity, the foundational drivers for BTC and blockchain technology continue to strengthen. Institutional interest, technological advancements, and growing adoption offer a solid backdrop for long-term growth.
For investors and traders, the critical task is to identify key price levels, monitor market sentiment through tools like the Fear & Greed Index, and stay informed of macroeconomic developments. By combining technical analysis with a macro perspective, you can position yourself to capitalize on Bitcoin’s next move — which, as history shows, could surprise many.
Whether you are a seasoned investor or new to crypto, understanding these dynamics is essential for making informed decisions in a rapidly changing market.
To stay ahead, consider joining communities and platforms that provide real-time trade ideas, educational content, and macro outlooks that cover not just crypto, but also stocks and commodities. This holistic view will better prepare you for the twists and turns ahead.
Happy investing, and remember: in the world of Bitcoin, crypto, and blockchain, knowledge is your most valuable asset.
Bitcoin’s Next Move Could Shock Everyone: Critical Levels Ahead for BTC, Crypto, and Blockchain Investors. There are any Bitcoin’s Next Move Could Shock Everyone: Critical Levels Ahead for BTC, Crypto, and Blockchain Investors in here.

